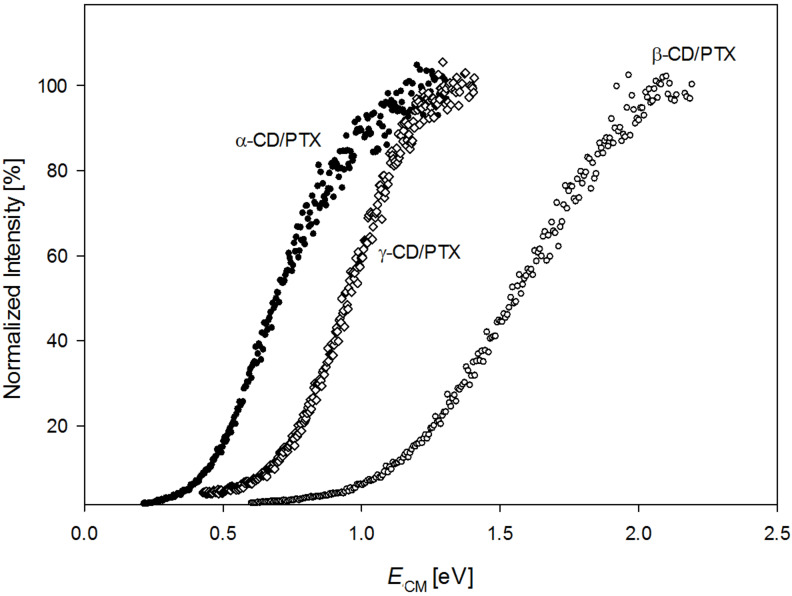
Figure 2.
Dissociation efficiency curves of three CDs/PTX complexes. The ions were collided with nitrogen (pressure ca. 2 × 10⁻⁵ Torr) at various collision energies. The y axis represents the normalized intensity of the PTX anion ([PTX − H]−) in proportion to the intensity of a complex ([CD + PTX − H]2−).

