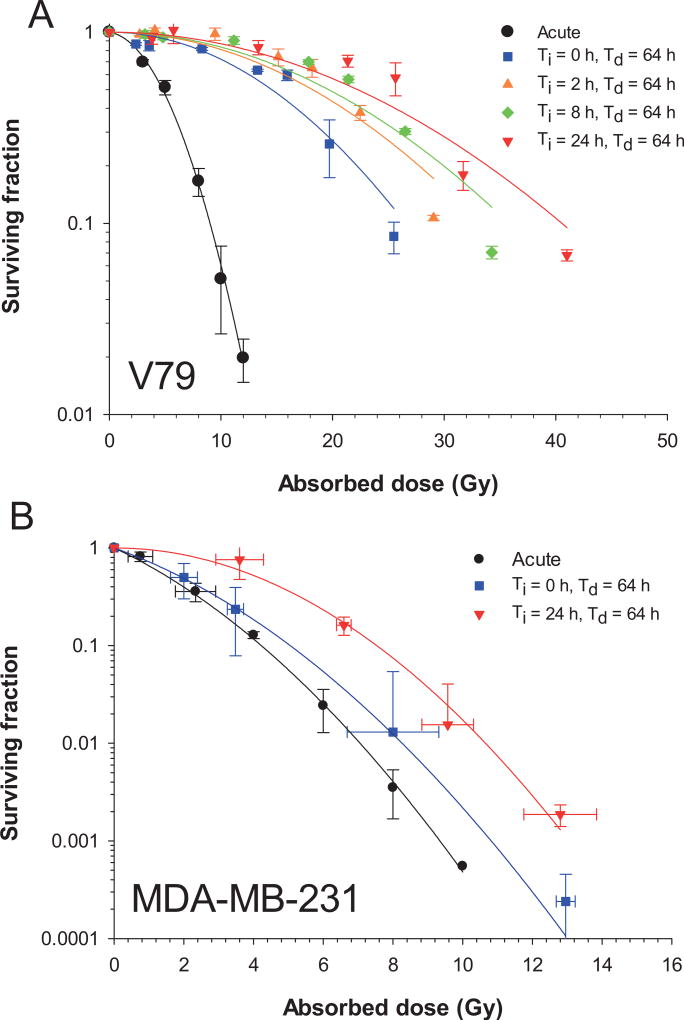
FIG. 4.
Panel A: Surviving fraction of Chinese hamster V79 lung cells as a function of absorbed dose after irradiation with 662 keV γ rays. Error bars represent the standard deviation of the surviving fraction based on the average of two experiments each for acute irradiation and irradiation with exponentially increasing (Ti = 0, 2, 8, or 24 h) followed by exponentially decreasing dose rates (Td = 64 h). Solid lines represent least squares fitting to the data to the linear-quadratic model (Table 2). Panel B: Cell survival curves for irradiated MDA-MB-231 human breast cancer cells. Flask positions were changed between successive experiments to achieve the desired number of logs of kill thereby resulting in somewhat different absorbed doses. Accordingly, data clusters on a graph of SF versus absorbed dose were averaged, and standard deviations were calculated for both SF and absorbed dose. Curves represent least squares fitting to the data to the linear-quadratic model.

