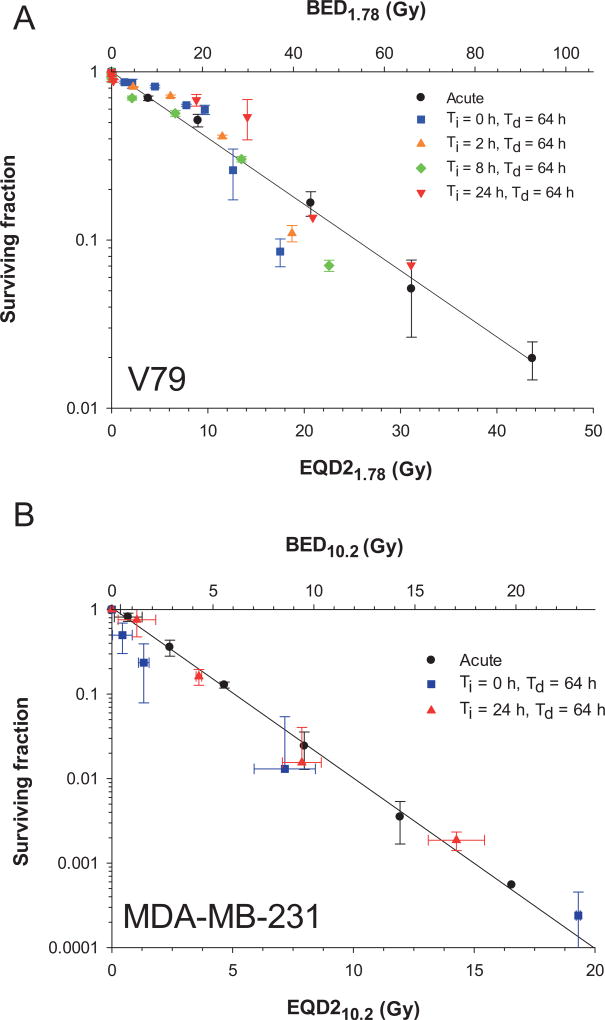
FIG. 6.
Panel A: Surviving fraction of V79 cells versus EQD21.78 (lower ordinate) and BED1.78 (upper ordinate) with the adaptive response function [Eq. (12)]. Error bars represent the standard deviation of the average surviving fraction obtained for two experiments of Ti = 24 h and Td = 64 h, Ti = 8 h and Td = 64 h, Ti = 2 h and Td = 64 h and Td = 64 h and acute dose. Panel B: Surviving fraction of MDA-MB-231 cells versus EQD210.2 (lower ordinate) and BED10.2 (upper ordinate) with the adaptive response function. The correction for adaptive response aligns the data for chronic irradiation more closely with the solid black line which represents the response to acute irradiation.

