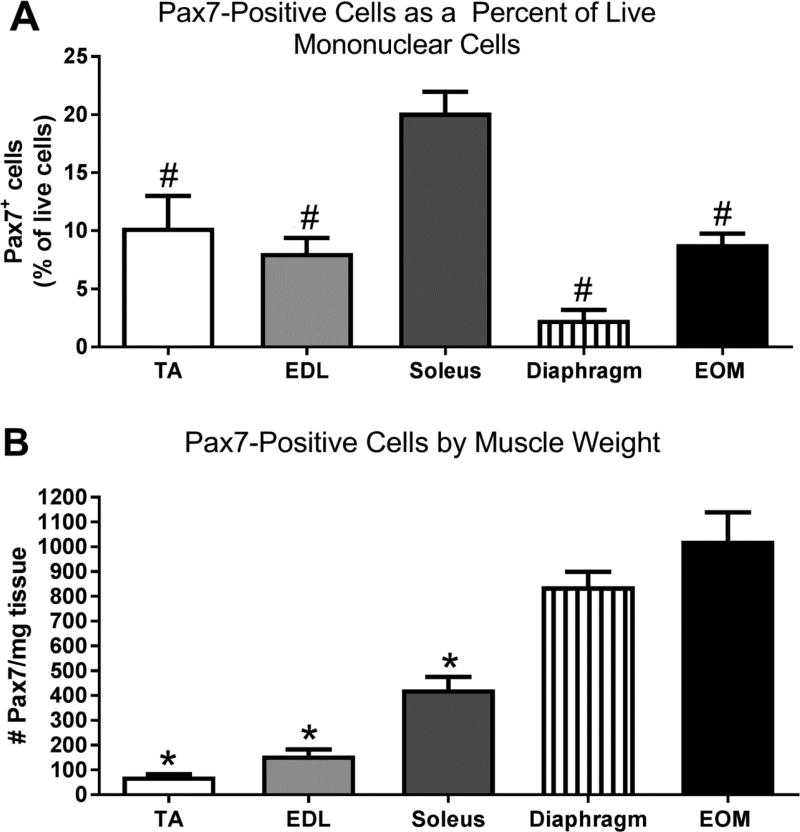
Figure 2.
Pax7 cells from a Pax7-tdTomato mouse isolated using flow cytometry analyzed (A) as a percent of all live mononuclear cells and (B) as number per milligram (mg) muscle weight. # indicates significant difference from soleus. * indicates significant difference from both diaphragm and EOM. Data analyzed with an ANOVA followed by a Tukey’s multiple comparisons test. Significance is p<0.05.

