
Figure 3.
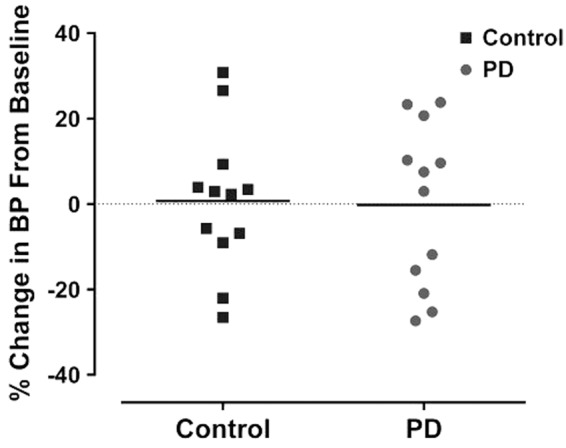
BP was comparable for both control and PD group at baseline. However, PD was not associated with significant % change in BP for both groups at nine weeks. Data points indicate individual rats and the horizontal bar represents the mean (p > 0.05, two-way ANOVA). PD: photoperiod disruption.