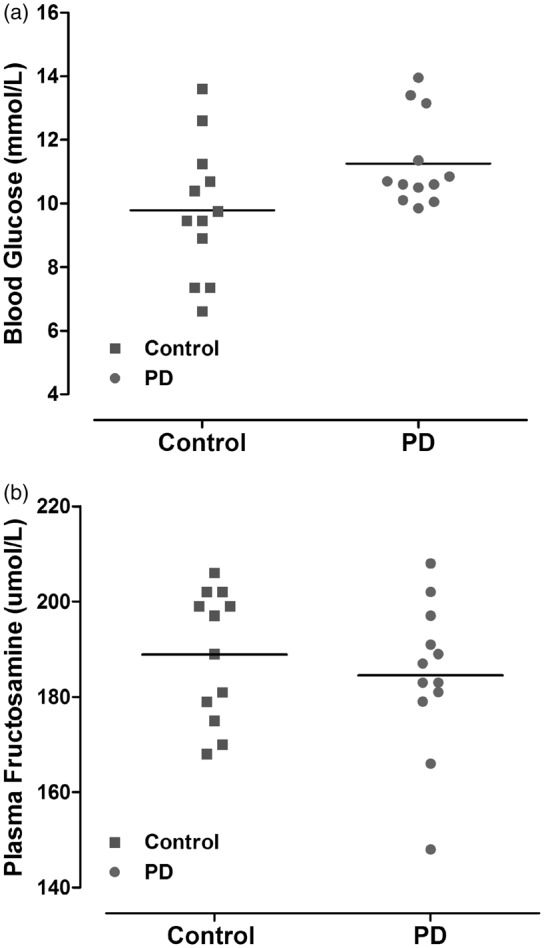
Figure 4.

Blood glucose levels immediately prior to MCAO (a). Data points indicate individual rat and the horizontal bar represents the mean. Plasma fructosamine level at 48 h after MCAO (b) reflects average glycaemic levels two to three weeks prior to MCAO (p > 0.05, Student unpaired t test). PD: photoperiod disruption.
