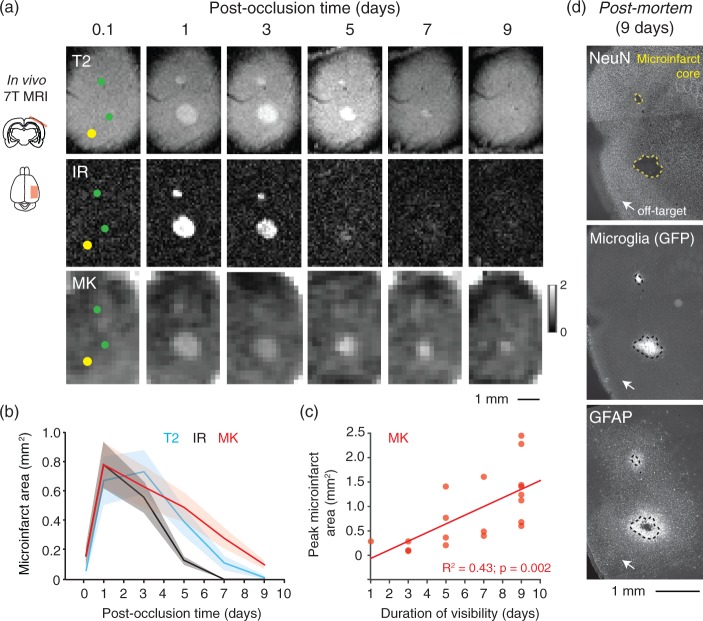
Figure 2.
MRI signals associated with evolution of microinfarct pathology. (a) Longitudinal imaging of two microinfarcts using IR, T2 and DKI (MK) sequences. Lower green circle shows location of a penetrating arteriole occlusion. Upper green circle shows location of penetrating venule occlusion. Yellow circle is the location of a control off-target irradiation. (b) Area of microinfarcts plotted as function of post-occlusion time. We detected a statistically significant difference between imaging sequences (p = 0.01 main effect F(2,38) = 5.2; two-way ANOVA with repeated measures). Tukey post hoc analysis revealed differences between T2 versus IR at three days (p = 0.003) and five days (p < 0.001), MK versus T2 at seven days (p = 0.003), and MK and IR at five days (p < 0.001) and seven days (p < 0.001). Data are mean ± SEM. Panels b and c comprise data from n = 12 penetrating arteriole and n = 8 penetrating venule occlusions over seven mice. (c) Larger microinfarcts exhibit longer durations of visibility with DKI (p = 0.002, R2 = 0.43, Pearson’s correlation). (d) Post-mortem histology of mouse shown in panel (a). NeuN immunostaining shows the extent of the microinfarct core (yellow dotted line). GFP-labeled microglia intrinsic to the transgenic mouse used (CX3CR1-GFP+/−) and GFAP immunostain show the extent of neuroinflammation in surrounding tissues.

