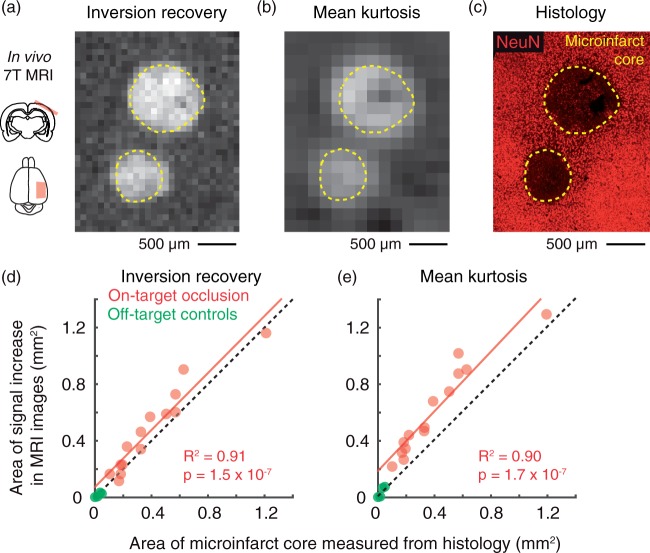
Figure 3.
MRI reports the acute microinfarct core. (a,b) IR and MK image of two microinfarcts 24 h after penetrating vessel occlusion. The upper and lower microinfarcts have resulted from arteriole and venular occlusions, respectively. (c) Mice were sacrificed for post-mortem histology immediately following MRI. NeuN staining was performed to identify the extent of the microinfarct core (yellow dotted line). (d, e) Scatterplot of microinfarct area measured in histology versus area of the same microinfarct measured in vivo with IR (p = 1.5 × 10⁻⁷, R2 = 0.91; Pearson’s correlation) or DKI (p = 1.7 × 10⁻⁷, R2 = 0.90; Pearson’s correlation). Data are from n = 8 penetrating arteriole and n = 6 penetrating venule occlusions over eight mice. Green data points correspond to microinfarcts generated by off-target control irradiations.

