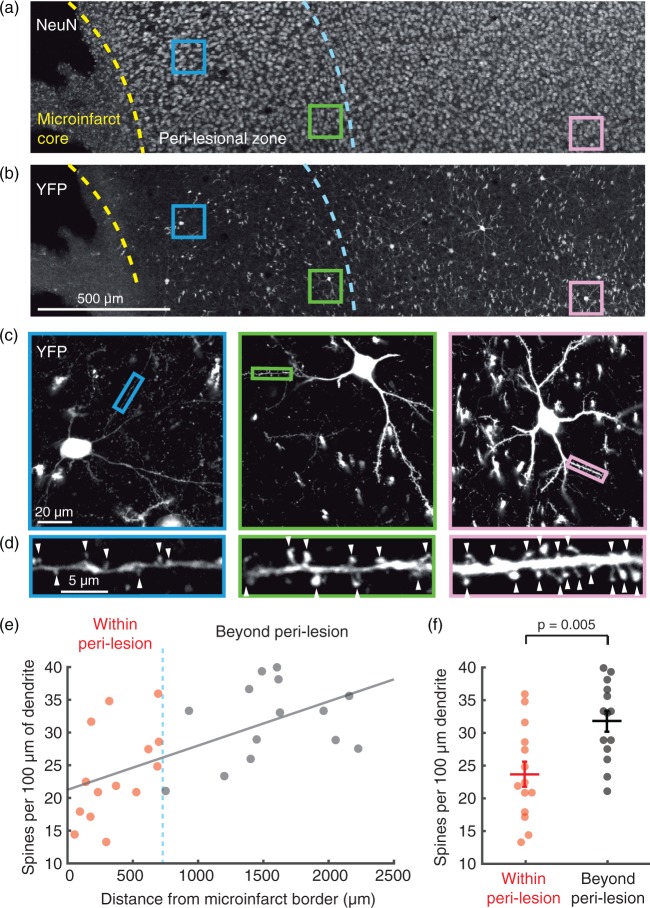
Figure 5.
Dendritic spine density is decreased in peri-lesional tissues. (a) Two days post-occlusion, absence of NeuN staining demarcates the microinfarct core, the border of which is traced with a yellow dashed line. Viable neurons exist beyond the microinfarct core, evidenced by robust NeuN staining, but C-fos studies in Figure 4 demonstrated functional deficits up to 700 um beyond the core (blue dashed line). (b) In the same slice, YFP brightly labels layer 2/3 cortical neurons and their processes. Colored squares highlight example YFP and NeuN-positive pyramidal neurons that were selected for high resolution imaging of dendrites. (c) High resolution confocal microscopy of dendrites. Images shown are 30 µm average intensity projections. Small colored rectangles indicate a typical dendritic segment used for spine counting. (d) Individual spines were manually counted along isolated dendritic segments (arrowheads), and divided by the length of dendritic segment analyzed to provide a measure of spine density. An average spine density for each neuron (n = 28 neurons in total) was calculated from several dendritic segments. (e) Mean spine density per neuron versus the neuron’s distance from the microinfarct core. Spine density decreases closer to the microinfarct core (Pearson, R2 = 0.38, p = 0.0005). (f) Cells within the peri-lesional region show a significant ∼25% decrease in spine density compared to cells beyond the peri-lesional region (n = 14 neurons/group compiled over two mice, p = 0.005 by Wilcoxon Rank-sum test). Data are mean ± SEM.

