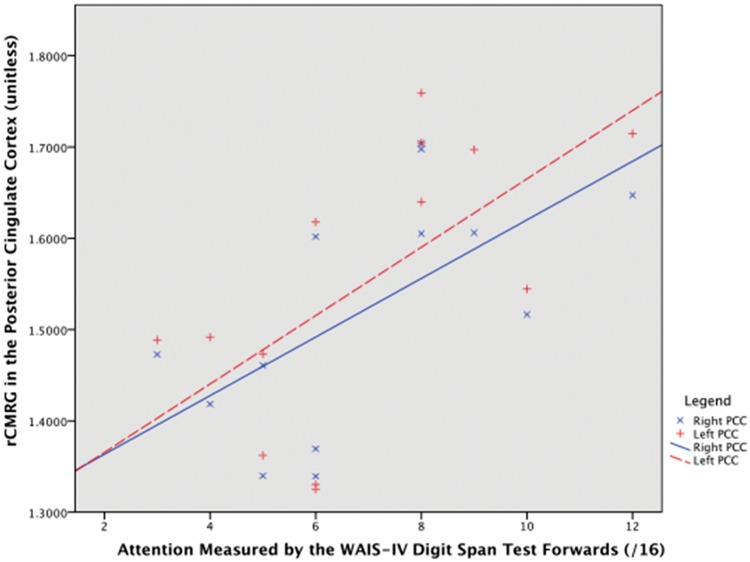
Figure 3.
Scatter plot of regional cerebral metabolic rate of glucose consumption in the posterior cingulate cortex against attention in participants with delirium. Legend: Attention improves along the x-axis. Right PCC, Spearman's ρ = 0.65, p-value = 0.017; left PCC, ρ = 0.65, p-value = 0.015.
rCMRG: regional cerebral metabolic rate of glucose consumption; PCC: posterior cingulate cortex.

