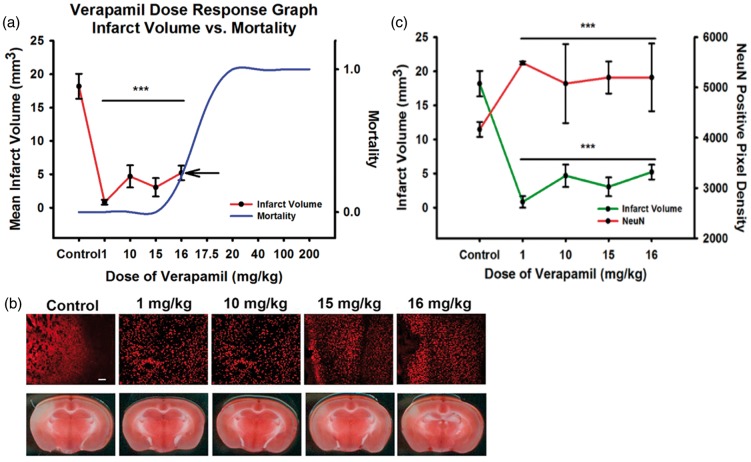
Figure 1.
In vivo dose–response experiments to evaluate IA verapamil. (a) Infarct volume was mapped against the dose-dependent mortality. All animals died at 17.5 mg/kg, with an estimated LD50 between 16 and 17.5 mg/kg. Infarct volume reduction demonstrated a likely plateau or inverted-U curve in dose-dependent efficacy up to the mortality curve. Examples of NeuN immunohistochemistry and TTC infarct volumes are shown (NeuN green fluorescence; TTC white is ischemia) (b) and plotted (c), demonstrating an expected inverse relationship between reduction of infarct volume with verapamil and improvement in NeuN staining that matches.

