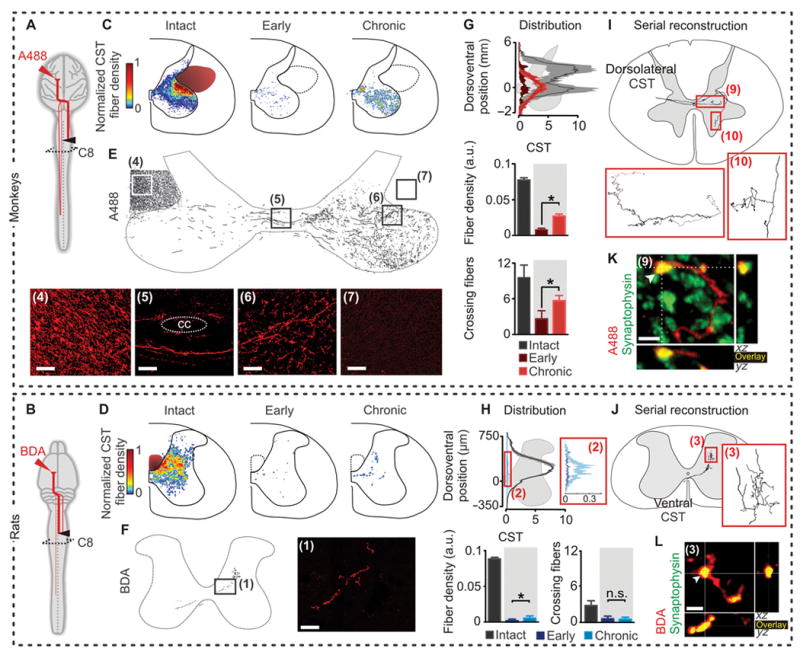
Figure 6. Monkeys show greater reorganization of corticospinal tract fibers compared to rats.

Corticospinal projection patterns were measured in rats and monkeys terminated at early (n = 8 rats and 3 monkeys) or chronic (n = 7 rats and 9 monkeys) time points after SCI. (A and B) Diagrams illustrating anatomical experiments. (C to F) Heat maps and representative images and reconstructions taken from boxed and numbered areas, illustrating sprouting of corticospinal axons in spinal segments below the lesion (CC, central canal). Scale bars, 100 μm for monkeys and 40 μm (insets: 10 μm) for rats. (G and H) Fiber density distribution, ipsilesional corticospinal axon density at C8, and number of corticospinal fibers crossing the spinal cord mid-line per analyzed section at C8, in intact animals and at early and chronic time-points post-SCI (a.u., arbitrary units). *p < 0.05, ANOVA. Data are means +/- s.e.m. (n = 8 monkeys; n = 9 rats for chronic subjects). (I and J) Serial reconstruction of a single corticospinal axon. (K and L) Representative confocal images of respective area in (I or J), showing 3D co-localization of D-A488 and synaptophysin in monkeys, and BDA and synaptophysin in rats, demonstrating the presence of synaptic terminals onto corticospinal fibers below the hemisection. Scale bars, 2 and 4 μm for monkeys and rats, respectively.
