
Figure 7. Syndromic analysis linking reorganization of corticospinal tract function and functional recovery.
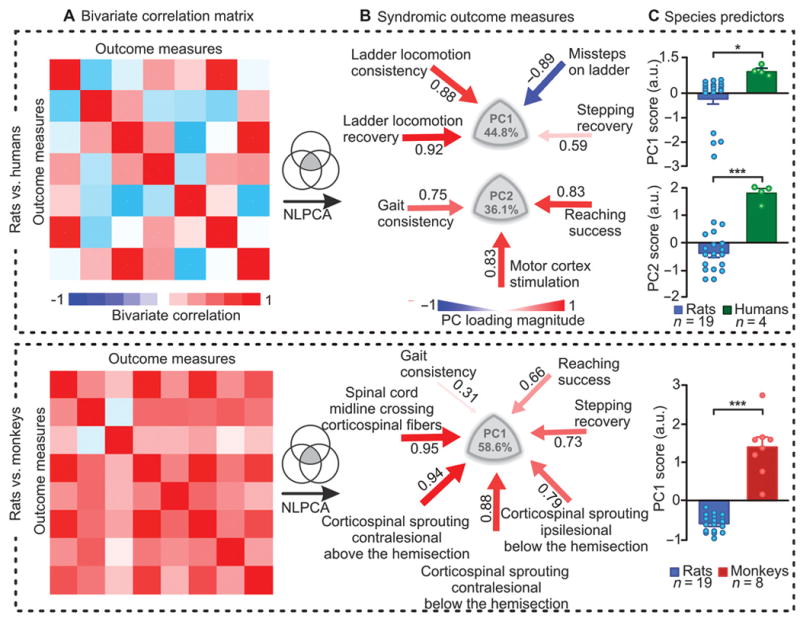
We used subsets of variables that were collected from rats and monkeys or from rats and humans, for direct cross-species comparisons. (A) Bivariate correlation matrix showing robust correlations between anatomical and functional parameters. (B) An NLPCA was applied on all the parameters measured in rats and humans, and in rats and monkeys. The data variance explained by PC1 and PC2 is reported. Color- and size-coded arrows indicate the direction and correlation (red, positive; blue, negative) between the parameters and each PC. Ipsilesional and contralesional refer to the origin of the corticospinal tract. (C) Mean scores on PC1 for both analyses, and on PC2 for human vs. rat. Each dot represents an individual subject. ***p < 0.001, **p < 0.01, unpaired two-tailed t-tests. Data are means +/- s.e.m. (n indicated in figure).