
Figure 2.
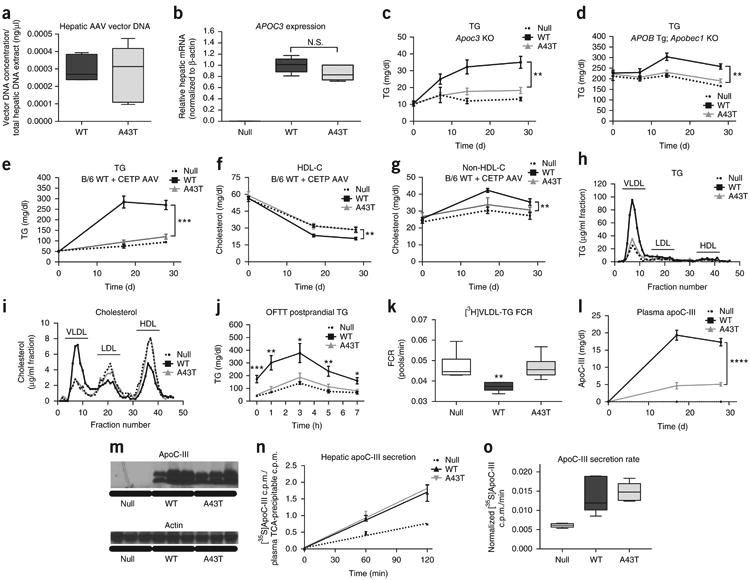
Mice expressing APOC3 A43T have reduced TRL and circulating apoC-III levels. (a) Hepatic AAV vector levels, as assessed by qRT–PCR for the rabbit β-globin poly(A) sequence, from 25 mg of liver tissue from mice treated with WT or A43T APOC3 AAV. (b) Hepatic APOC3 mRNA levels (normalized to those of actin) in mice treated with WT or A43T APOC3 AAV. (c) Fasting plasma TG concentrations in Apoc3-knockout mice treated with Null, WT APOC3, or A43T APOC3 AAV at the indicated time points after AAV injection. (d) Fasting plasma TG concentrations in human-APOB-transgenic/Apobec1-knockout mice treated with the indicated AAVs. (e–g) Fasting plasma TG concentrations (e), plasma HDL-C concentrations (f), and plasma non-HDL-C concentrations (g) in WT mice treated with the indicated AAVs and co-treated with AAV encoding human CETP. (h,i) TG (h) and cholesterol (i) concentrations in FPLC-separated plasma fractions from day 28 plasma from the mice in e–g. Lipoprotein fractions are indicated above the fraction numbers. (j) Postprandial TG concentrations in Apoc3-knockout mice treated with the indicated AAVs and co-treated with AAV encoding human CETP, following olive oil gavage (OFTT, oral fat tolerance test). (k) Plasma [3H]TRL-TG FCR in WT mice treated with the indicated AAVs, 2 h after intravenous administration of [3H]triolein-labeled human TRLs. (l) Fasting plasma apoC-III concentrations in mice from e–g. (m) Immunoblots for apoC-I II using total protein from liver lysates of WT mice, 28 d after AAV administration. β-actin was used as a loading control. Cropped immunoblots are shown; corresponding uncropped blots are shown in Supplementary Figure 8. (n) Hepatic apoC-III secretion in WT mice treated with the indicated AAVs, 35 d after AAV administration and after treatment with [35S]methionine tracer. ApoC-III secretion is defined as [35S]methionine radioactivity in apoC-III bands isolated from protein electrophoresis, normalized to [35S]methionine radioactivity in total TCA-precipitable protein from 2 μl of plasma. (o) ApoC-III secretion rates as measured by the slope of the curves in n. In c, data are shown from n = 5 Null mice, n = 7 WT mice, and n = 7 A43T mice. In a, b, d–g, and j–l, data are shown from n = 6 mice in each group. In n and o, data are shown from n = 5 mice from each group. Data show results from one representative experiment, and all experiments were repeated once in independent respective cohorts of mice. For data in a, b, k, and o, box length spans the 25th to 75th percentile range of the data points, with the middle line indicating the median and whiskers indicating the minimum and maximum values for the given data set. All other measurements show mean ± s.e.m. All data points represent measures from individual mice from a single experiment, and data in all panels were replicated in two independent experiments. *P < 0.05, **P < 0.01, ***P < 0.001, ****P < 0.0001, two-way ANOVA, WT versus A43T group; N.S., not significant.