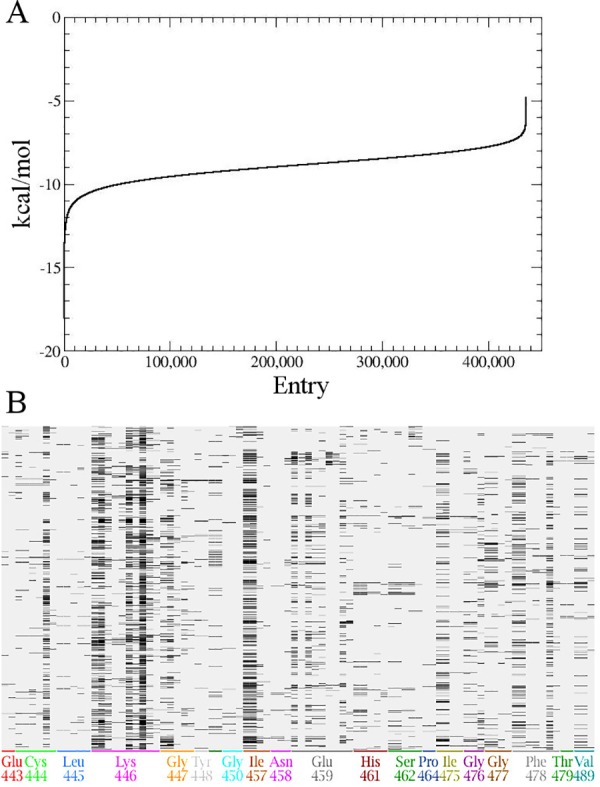
Fig 2. Virtual high-throughput screening on Notch2 interaction surface.

(A) Plot of the docking score according to the London dG empirical scoring function for the resulting 435,835 compounds after the first virtual screening docking phase. The Y axis reports the docking score (kcal/mol) of the unique pose obtained for each tested entry (X axis). These values are sorted according to ascending docking score values along the Y axis. (B) Protein Ligand Interaction Fingerprint between Notch and the 30 retained docking poses for all the 25 best-scoring compounds tested in the second docking phase. The barcode display represents each docking pose (row) and protein::ligand fingerprints bit (column) as a matrix, in which a set bit is drawn as a black rectangle; the X-axis shows the residue that corresponds to each group of fingerprint bits, and is coded with an arbitrary sequence of colors.
