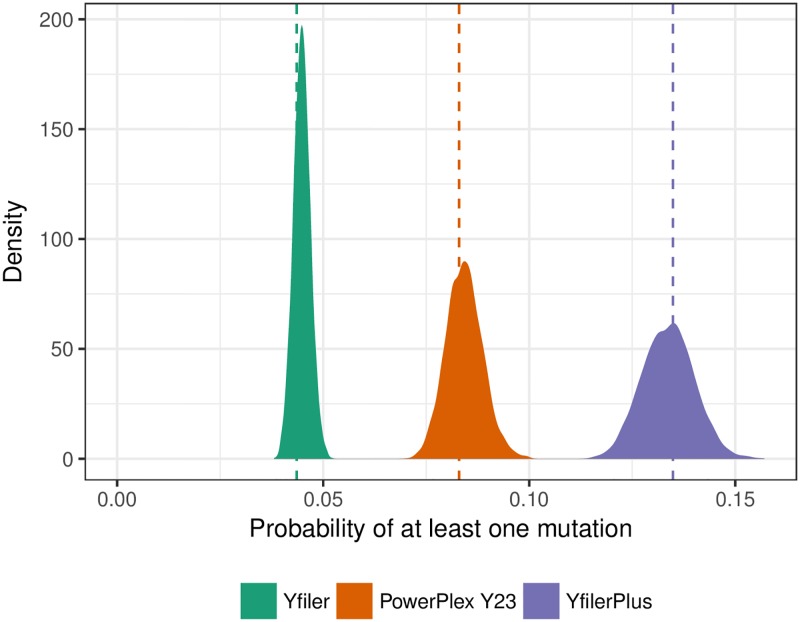
Fig 1. Posterior distributions of the mutation rates.
The posterior distributions of the whole-profile per-generation mutation rates for each of three profiling kits: Yfiler, PowerPlex Y23, and Yfiler Plus (see Materials and Methods). Vertical dashed lines indicate maximum-likelihood estimates. See S1 Table for details of the underlying mutation count data.

