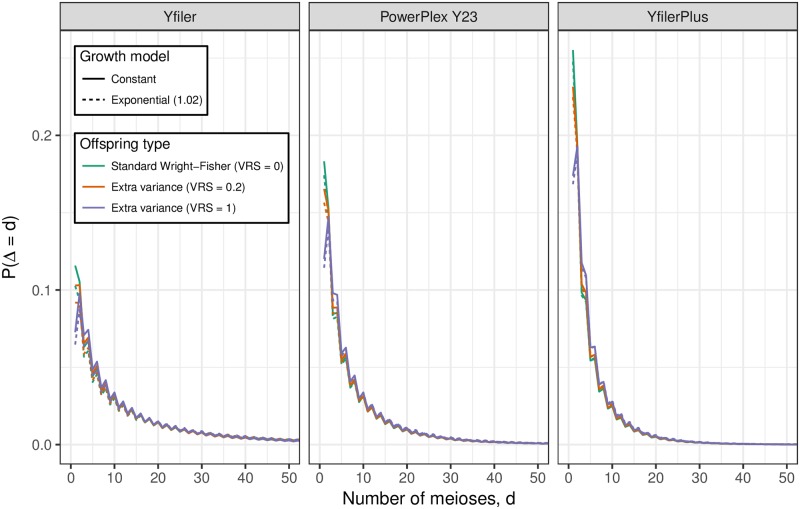
Fig 5. The distribution of Δ, the number of father-son steps between Q and another male in Ω.
The distribution is shown for each of three profiling kits, three values of VRS and with and without population growth. See S2 Table for numerical properties of these distributions.

