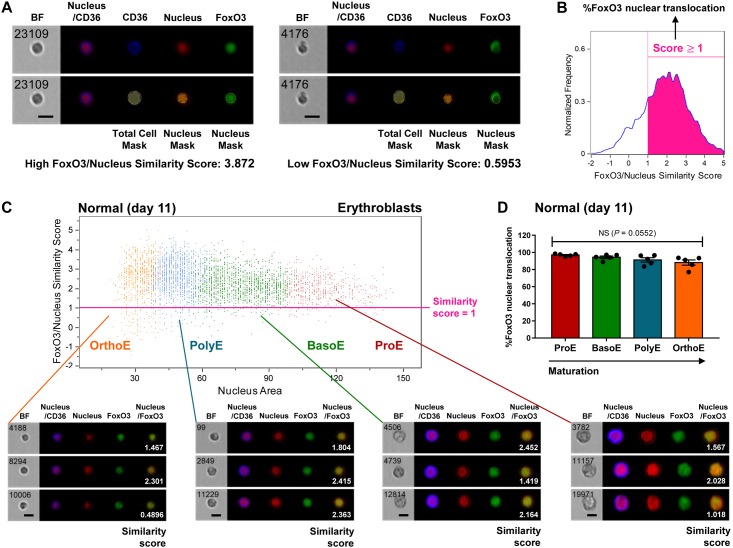
Fig 2. Normal erythroblasts display high levels of FoxO3 nuclear translocation.
(A) Representative imaging flow cytometry analysis of FoxO3/nucleus similarity scores. Total cell mask and nucleus mask were monitored based on CD36 and PI signals, respectively. The degree of similarity between the images of nucleus and FoxO3, the FoxO3/nucleus similarity score, were used to determine the levels of FoxO3 nuclear localization. (B) Representative quantification of percent FoxO3 nuclear translocation from the cell population based on FoxO3/nucleus similarity scores. (C) The similarity scores of normal erythroblasts observed on day 11 shown with brightfield (BF) images, fluorescence images, and similarity scores (white numbers). Fluorescence data show the following markers: merged images of propidium iodide (red) and CD36 (blue) representing cell morphology; images of propidium iodide; images of FoxO3 (green); and merged images of nucleus and FoxO3. (D) % FoxO3 nuclear translocation of each stage of normal erythroblasts on day 11. The data are presented as means ± SEM (n = 5 independent experiments).

