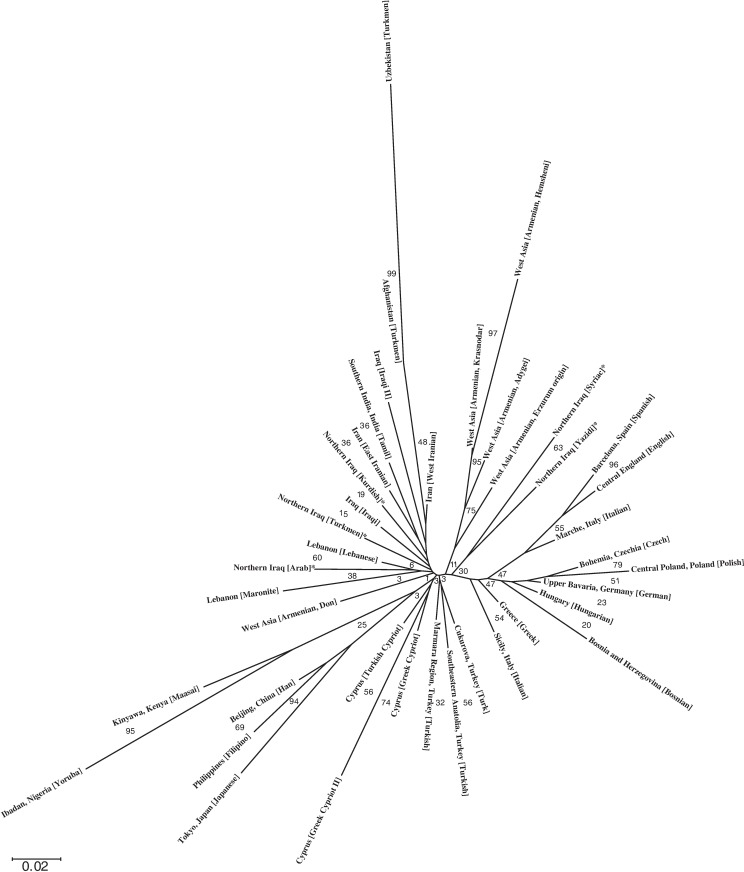
Fig 3. An N-J phylogenetic tree showing genetic distances among the 40 nearby and distant populations.
Asterisks (*) mark populations from the present study. Numerical assignments at each node denote the calculated bootstrap value at that node. A scale bar corresponding to the phylogenetic tree branch lengths is also provided.

