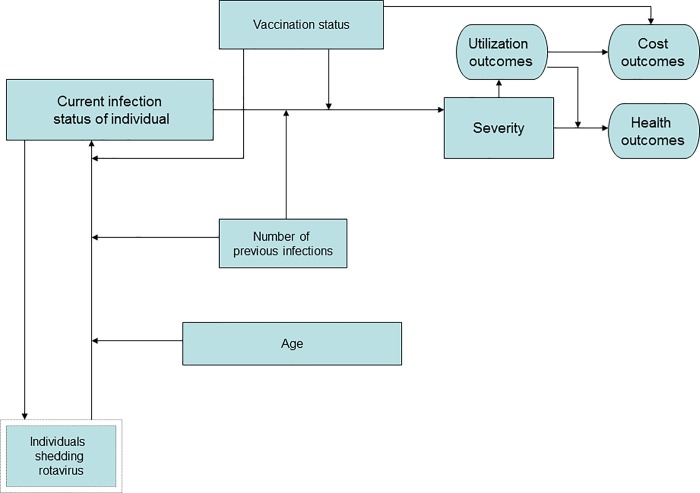
Fig 2. Model schematic.
Factors (rectangles) which determine each individual’s probability of infection during a given model cycle and, ultimately, their outcomes (ovals) in terms of health services utilization, cost, and health. Single rectangles represent individual-level factors, and the double rectangle represents a population-level factor.

