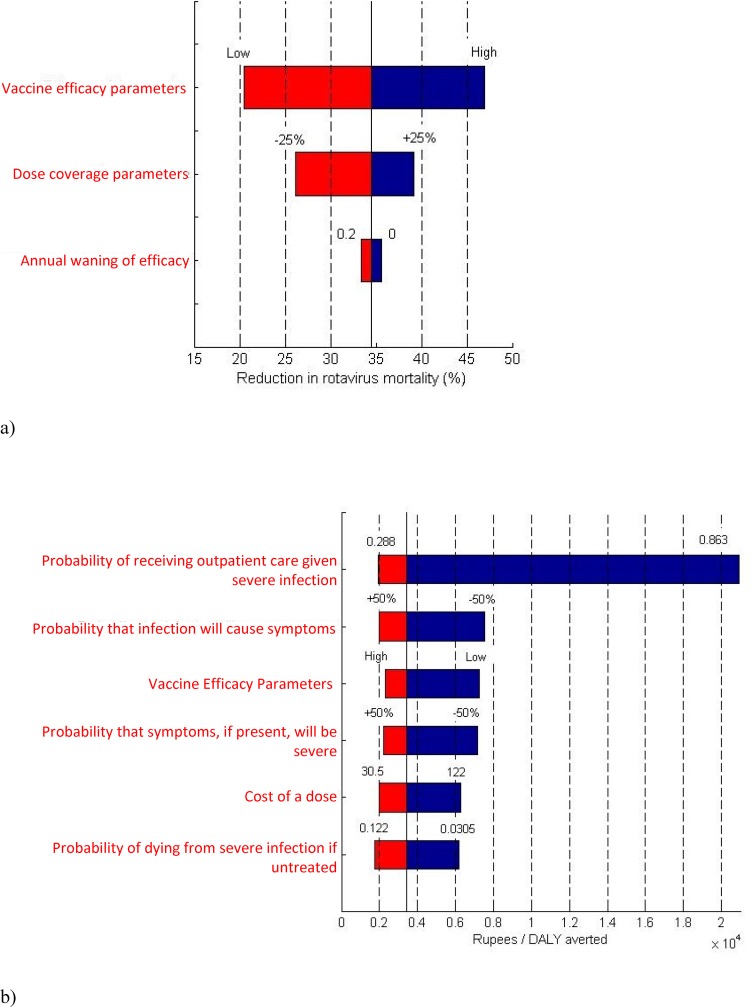
Fig 3. Highlighted sensitivity analysis results.
a) Model parameters which, when varied over the ranges specified in Tables 1–3, have the greatest impact on rotavirus mortality reduction. The percent reduction in rotavirus mortality is shown on the x-axis. The solid black line indicates the baseline mortality reduction (34.6%). Bounds expressed in percentages (e.g. +/-25%), represent relative percentages. b) Model parameters which, when varied, have the greatest impact on the ICER. The ICER (in Rs) is on the x-axis. The solid black line indicates the baseline ICER (Rs 3,429 per DALY averted).

