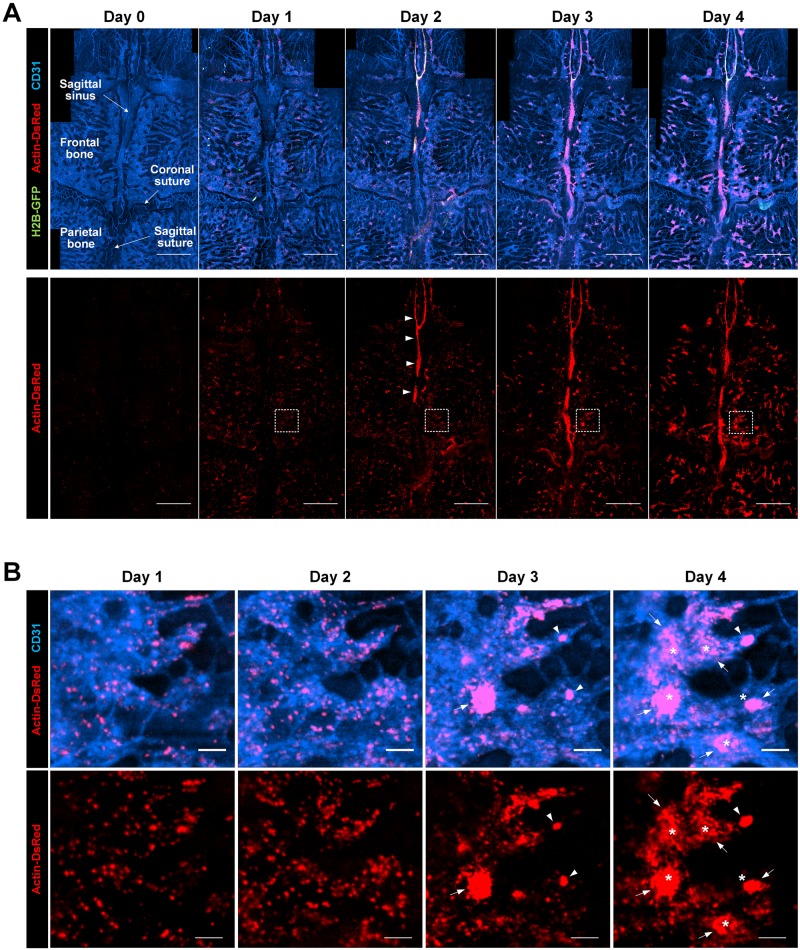
Fig 1. Longitudinal wide-area visualization of the cellular-level behavior of the transplanted BM cells.
Mosaic and magnified images longitudinally obtained from the calvarial bone marrow of the recipient mouse in vivo. (A) (upper panel) Mosaic images showing the transplanted BM cells (red, actin-DsRed in the cytoplasm and nucleus; green, H2B-GFP in the nucleus) and vascular sinus (blue). (lower panel) Red-color separated mosaic images highlighting the distribution of the transplanted BM cells on each day. (B) Magnified images of (A) at the region marked with dotted squares. The large BM cell clusters with a size larger than 5,000 μm2 were marked with an arrow. The small BM cell clusters with a size ranging from 500–5,000 μm2 were marked with an arrowhead. The asterisk indicates the BM cell cluster with a significantly increased size at day 4. Scale bars are (A) 1 mm, and (B) 100 μm, respectively.

