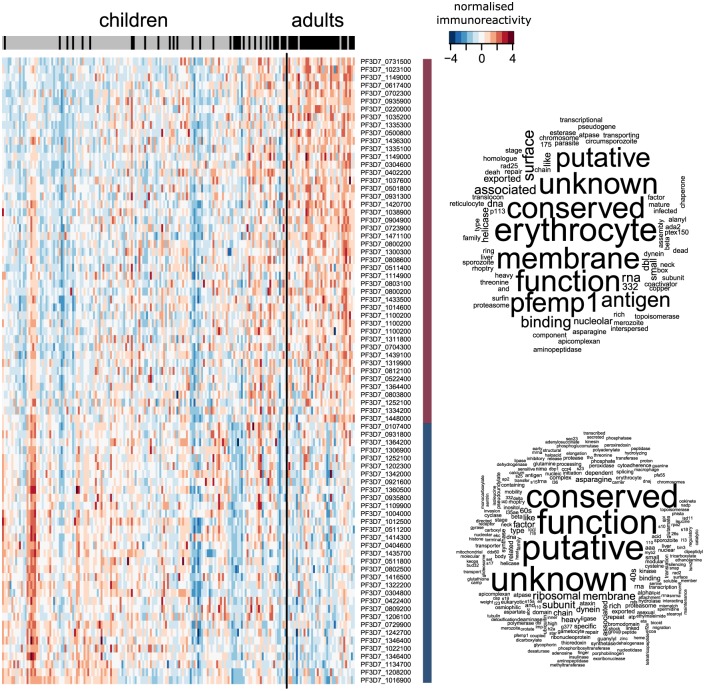
Fig 4. Immunoreactivity heatmap of feature-selected antigens from the MAL dataset when considering all individuals.
Antigens identified as important predictors for clinical immunity show either an increase or decrease in intensity as individuals get older under repeated exposure to the parasite. The columns are the responses from each individual, ordered by age (young to old, from left to right), and separated into children (≤ 10 years) and adults (≥ 18 years). The bar at the top indicate the individual’s protective status (grey: susceptible, black: protected), highlighting the strong correlation between age and clinical protection. The word cloud of the protein product description stratified by whether the response had an increasing or decreasing trend with age, is based on the selected features and any other proteins they are highly correlated with (ρ > 0.8).

