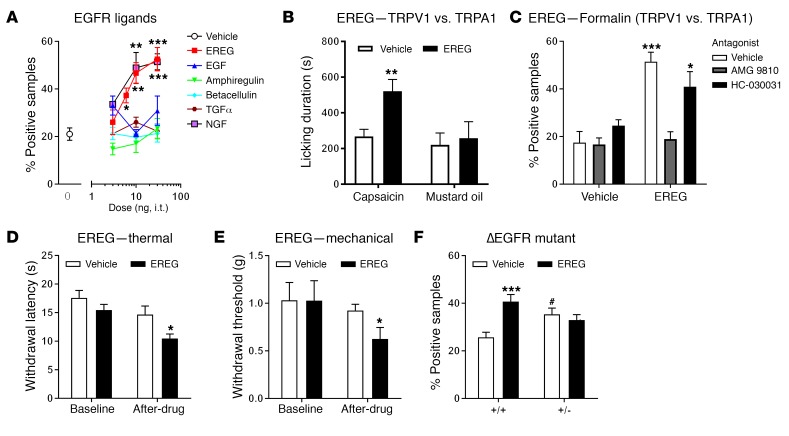
Figure 2. Spinally administered EREG, but not other EGFR ligands, produces hypersensitivity.
(A) Significant and dose‑dependent hypersensitivity from EREG (2-way ANOVA, F3,26 = 6.8, P = 0.002), but not betacellulin, amphiregulin, EGF, or TGF-α (all P values are greater than 0.50) in the late phase (10–60 minutes) of the formalin test. Symbols represent mean ± SEM for percentage of samples featuring licking/biting behavior; n = 6–8/drug/dose. EREG enhancement of formalin-induced licking was equivalent to that of NGF; 2-way ANOVA, F3,22 = 10.9, P < 0.001. (B) EREG (10 ng, i.t.) increases nocifensive behavior when coadministered with intraplantar injections of the TRPV1 agonist capsaicin (2-tailed t test, t10 = 3.4, P = 0.01), but not the TRPA1 agonist mustard oil (2-tailed t test, t13 = 0.34, P = 0.70). Bars represent mean ± SEM for duration of licking behavior over 10 minutes after injection; n = 6‑8/algogen/drug. (C) The TRPV1 antagonist AMG 9810 (30 mg/kg, i.p.), but not the TRPA1 antagonist HC-030031 (30 mg/kg, i.p.), blocks EREG-induced hyperalgesia during the formalin test (2-way ANOVA, drug × antagonist interaction: F2,38 = 7.2, P = 0.002). Bars as in graph A; n = 7-8/group. (D) EREG (10 ng) increases thermal sensitivity by itself (2-tailed paired t test, t10 = 2.6, P = 0.03). Bars represent mean ± SEM for latency to withdraw from a noxious thermal stimulus before (baseline) and 30 minutes after injection; n = 6/drug. (E) EREG (10 ng) increases mechanical sensitivity by itself (2-tailed paired t test, t10 = 2.2, P = 0.05). Bars represent mean ± SEM for hind paw–withdrawal threshold (g) before (baseline) and 30 minutes after injection; n = 6/drug. (F) ΔEGFR mutants have higher baseline pain sensitivity to formalin than WT (vehicle groups), but no longer respond to EREG (10 ng, i.t.). Bars as in graph E; n = 7–8/genotype/drug. For all panels, *P < 0.05; **P < 0.01; ***P < 0.001 compared with vehicle (0) by Dunnett’s case-comparison post hoc test or t test as indicated. #P < 0.01 compared with other genotype (in F) by Dunnett’s case-comparison post hoc test.

