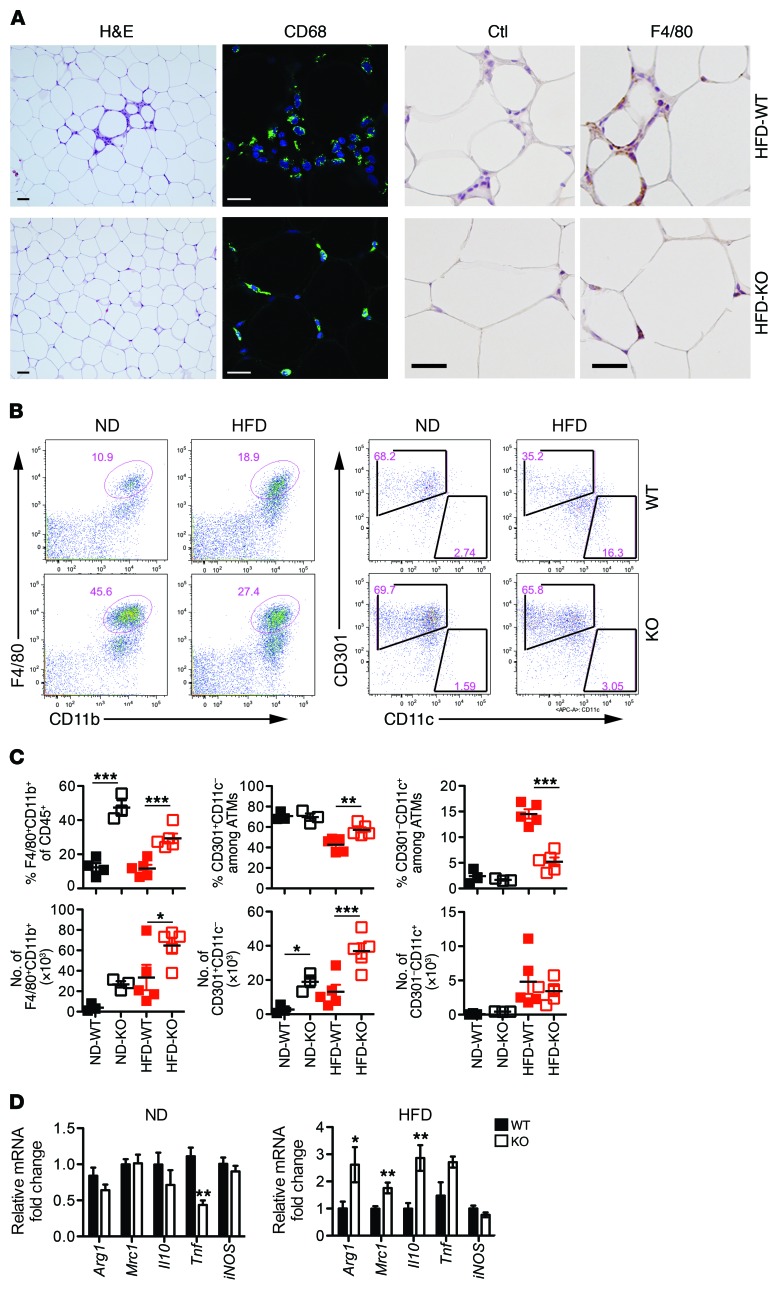
Figure 2. Reduced inflammation and increased M2 macrophages in adipose tissue of obese cad-11–/– mice.
WT and cad-11–/– mice were fed a HFD for 12 weeks, unless otherwise indicated. (A) Representative fluorescence microscopic images with H&E and anti-CD68 macrophage whole-mount staining (scale bars: 20 μm), and IHC with staining for isotype control (Ctl) and F4/80 (scale bars: 10 μm) in eWAT. (B) Representative flow cytometric analysis for adipose tissue macrophages in the CD45+ gate of SVF cells (left panel) and the F4/80hiCD11b+ gate of macrophages (right panel). (C) Percentage and number of F4/80hiCD11b+ macrophages (total), CD301+CD11c– macrophages among total macrophages (M2), and CD301–CD11c+ macrophages among total macrophages (M1) in eWAT (n = 4 ND-WT, n = 3 ND-KO, n = 5 HFD-WT, and n = 5 HFD-KO). Data are representative of more than 3 independent experiments. ATMs, adipose tissue macrophages. (D) qPCR analysis of the indicated genes in adipose tissue from mice fed a ND (n = 10 ND-WT and n = 10 ND-KO; pooled from 2 independent experiments) or a HFD (n = 6 HFD-WT and n = 5 HFD-KO; 1 of 3 independent experiments) for 10 weeks. Data are expressed as the mean ± SEM. *P < 0.05, **P < 0.01, and ***P < 0.001, by 2-way ANOVA (C) and unpaired Student’s t test (D).

