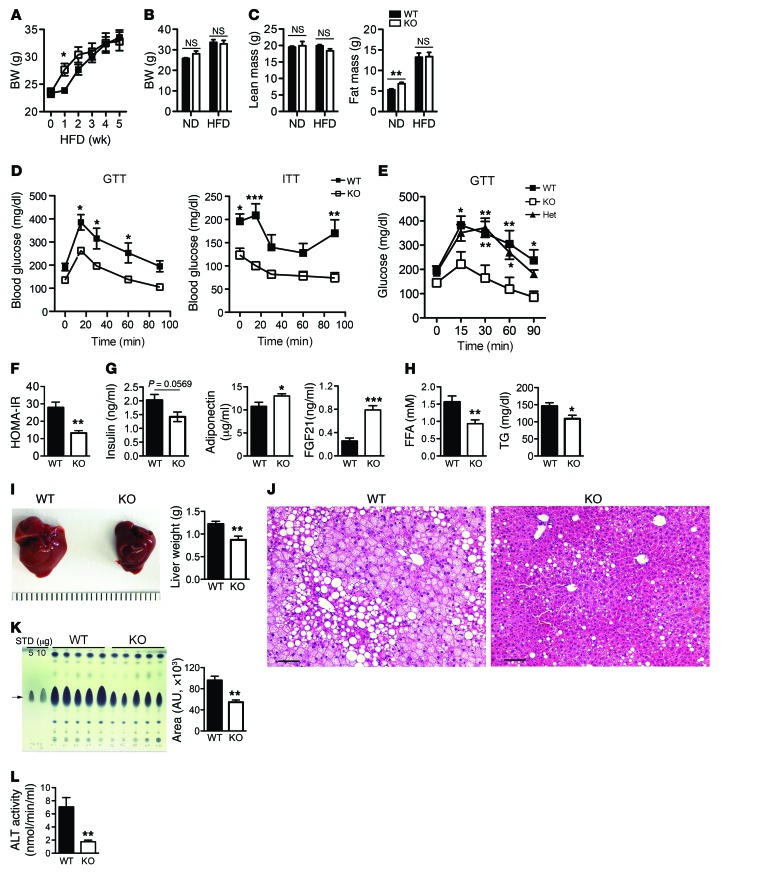
Figure 5. Cadherin-11–/– deficiency protects obese mice from poor glycemic control.
WT and cad-11–/– mice were fed a HFD for 5 weeks, unless otherwise indicated. (A) BW of mice on a HFD (n = 5 HFD-WT and n = 4 HFD-KO). Data are representative of more than 3 independent experiments. EchoMRI analysis for (B) BW and (C) lean and fat mass (n = 7 ND-WT, n = 5 ND-KO, n = 5 HFD-WT, and n = 4 HFD-KO). Data are representative of 2 independent experiments. (D) GTTs and ITTs for WT and cad-11–/– mice fasted overnight for the GTT (n = 9 HFD-WT and n = 8 HFD-KO) and fasted 4 hours for the ITT (n = 4 HFD-WT and n = 5 HFD-KO). Data are representative of more than 3 independent experiments. (E) GTTs for littermates of WT and cad-11–/– mice fed a HFD for 5 weeks (n = 7 HFD-WT, n = 7 HFD-Het, and n = 5 HFD-KO). Het, heterozygous. (F) HOMA-IR index. (G) Serum levels of insulin (n = 5 HFD-WT and n = 5 HFD-KO), adiponectin, and FGF21 (n = 8–9 per group, pooled from 2 independent experiments). (H) Serum levels of FFA (n = 10 per group) and TG (n = 17–18 per group, pooled from 3 independent experiments). Serum factor analyses were done separately with serum samples collected from 3 independent experiments. (I) Representative image of livers and graph showing liver weights for WT and cad-11–/– mice (n = 10 per group, combined from 2 independent experiments). (J) Representative H&E staining of liver sections from WT and cad-11–/– mice fed a HFD for 12 weeks. Scale bars: 100 μm. (K) TLC analyses of nonpolar lipids isolated from livers of obese WT and cad-11–/– mice. Arrow indicates the TG-specific bands as determined by the TG standards (STD) on the TLC plate. Graph shows ImageJ densitometric analysis of TLC-resolved TG (n = 5 HFD-WT and n = 5 HFD-KO). Data are representative of 2 independent experiments. (L) Analysis of ALT activity in serum collected from mice fed a HFD for 12 weeks (n = 7 HFD-WT and n = 6 HFD-KO, combined from 2 independent experiments). Data are expressed as the mean ± SEM. *P < 0.05, **P < 0.01, and ***P < 0.001, by unpaired Student’s t test (A–C, F–I, K, and L) and 2-way ANOVA, for WT and cad-11–/– mice (D and E).

