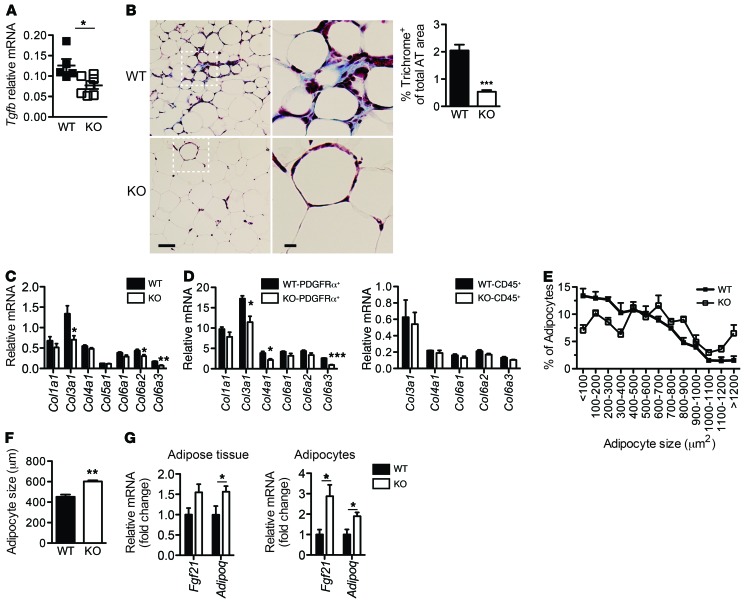
Figure 6. Less fibrotic adipose tissue of cad-11–/– mice contains healthy adipocytes in obesity.
(A) mRNA expression of Tgfb in obese adipose tissue of WT and cad-11–/– mice (n = 5 HFD-WT and n = 7 HFD-KO). Data are representative of 2 independent experiments. (B) Representative Masson’s trichrome staining of adipose tissue from WT and cad-11–/– mice fed a HFD for 12 weeks. Scale bars: 100 μm and 20 μm (insets). The percentage of blue-colored trichrome-positive staining of the adipose tissue (AT) area was measured with ImageJ (15 images were taken from HFD-WT [n = 3]; 11 images were taken from HFD-KO [n = 4] mice). Data are representative of 2 independent experiments. (C) qPCR analysis of collagens in adipose tissue (n = 5 HFD-WT and n = 7 HFD-KO). Data are representative of 2 independent experiments. (D) qPCR analysis of flow-isolated PDGFRα+ fibroblasts and CD45+ cells (n = 3 HFD-WT and n = 3 HFD-KO). Data are representative of 2 independent experiments. (E) Size distribution of adipocytes. (F) Average size of adipocytes. Adipocyte size was measured by ImageJ in H&E-stained adipose tissue from WT and cad-11–/– mice fed a HFD for 5 weeks (46 images were taken from HFD-WT [n = 4]; 44 images were taken from HFD-KO [n = 6] mice). Data are representative of 2 independent experiments. (G) qPCR analysis of adiponectin and FGF21 in adipose tissue and isolated adipocytes from WT and cad-11–/– mice fed a HFD for 12 weeks (n = 5 HFD-WT and n = 7 HFD-KO). Data are representative of 2 independent experiments. Data are expressed as the mean ± SEM. *P < 0.05, **P < 0.01, and ***P < 0.001, by unpaired Student’s t test (A–D, F, and G).

