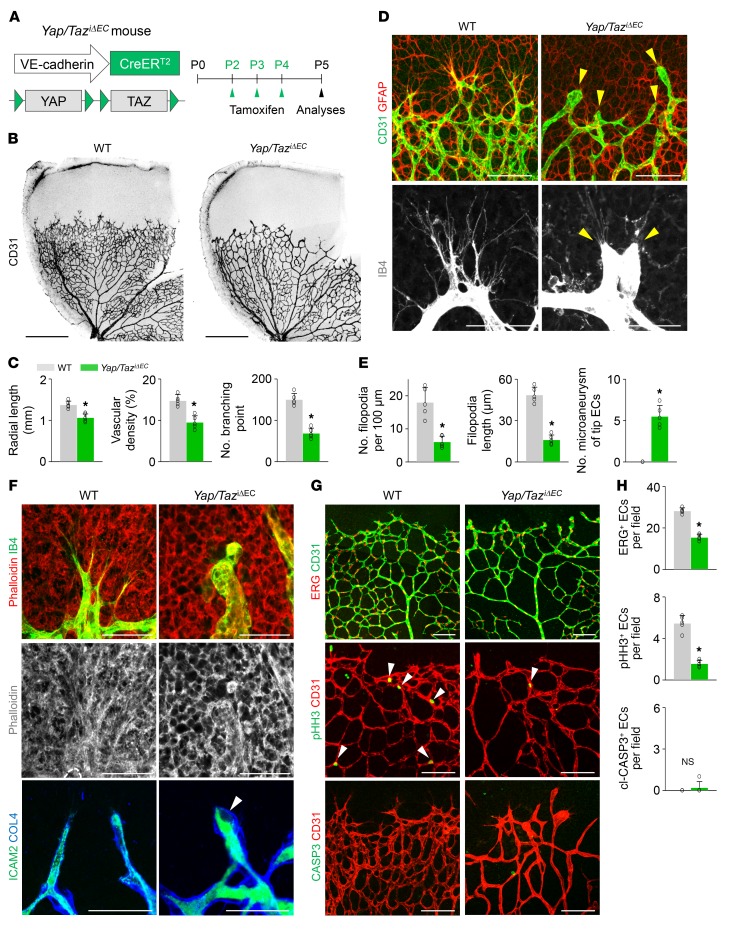
Figure 1. Endothelial YAP/TAZ is a crucial regulator of vascular sprouting and growth.
(A) Diagram for EC-specific depletion of YAP/TAZ in retinal vessels from P2 and their analyses at P5 using Yap/TaziΔEC mice. (B and C) Images of CD31+ retinal vessels and comparisons of indicated parameters in WT and Yap/TaziΔEC mice (n = 5, each group). Scale bars: 500 μm. (D and E) Magnified images and comparisons of retinal vessels in the vascular front region of WT and Yap/TaziΔEC mice at P5 (n = 5, each group). Tip ECs in Yap/TaziΔEC mice exhibit an aneurysm-like structure with less and dysmorphic filopodia (yellow arrowheads). Scale bars: 100 μm, top panels; 50 μm, bottom panels. (F) Images showing phalloidin+ actin filament (F-actin) bundle and ICAM2+/collagen IV+ (COL4+) lumen formation in tip ECs of WT and Yap/TaziΔEC mice. No organized F-actin bundle–containing protrusions and defective lumen formation (white arrowhead) are detected in tip ECs of Yap/TaziΔEC mice. Scale bars: 50 μm. (G and H) Images and comparisons of ERG+ ECs, pHH3+ proliferating ECs (white arrowheads), and cl-CASP3+ apoptotic ECs in WT and Yap/TaziΔEC mice (n = 5, each group). Scale bars: 100 μm. Error bars represent mean ± SD. *P < 0.05 vs. WT by Mann-Whitney U test.

