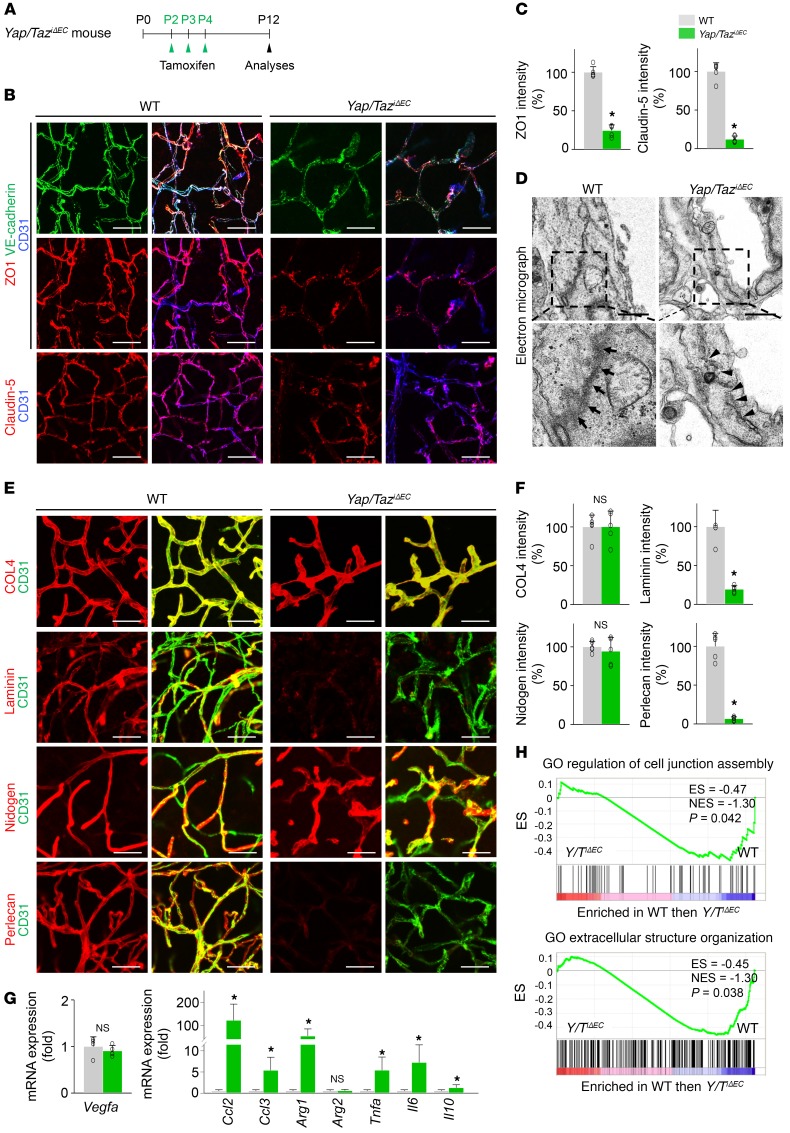
Figure 7. Endothelial YAP/TAZ is indispensable for BBB maturation.
(A) Diagram for EC-specific deletion of Yap/Taz in brain vessels from P2 and their analyses at P12 in Yap/TaziΔEC mice. (B and C) Images and comparisons of distributions of VE-cadherin, ZO1, and claudin-5 on CD31+ vessels in cerebral striatum of WT and Yap/TaziΔEC mice (n = 5, each group). Scale bars: 50 μm. (D) Electron microscopic images showing electron-dense and continuous junction between brain ECs in WT mice (arrows), while junction between ECs is disrupted and less electron-dense in Yap/TaziΔEC mice (arrowheads). Scale bars: 1 μm. (E and F) Images and comparisons of levels of COL4, laminin, nidogen, and perlecan on CD31+ vessels in cerebral striatum of WT and Yap/TaziΔEC mice (n = 5, each group). Scale bars: 50 μm. (G) Comparisons of expressions of indicated mRNA in brains of WT and Yap/TaziΔEC mice (n = 4, each group). (H) GSEA showing downregulated GO terms “cell junction assembly” and “extracellular structure organization” in brain ECs of Yap/TaziΔEC mice compared with those of WT mice. ES, enrichment score; NES, normalized enrichment score. Error bars represent mean ± SD. *P < 0.05 vs. WT by Mann-Whitney U test.

