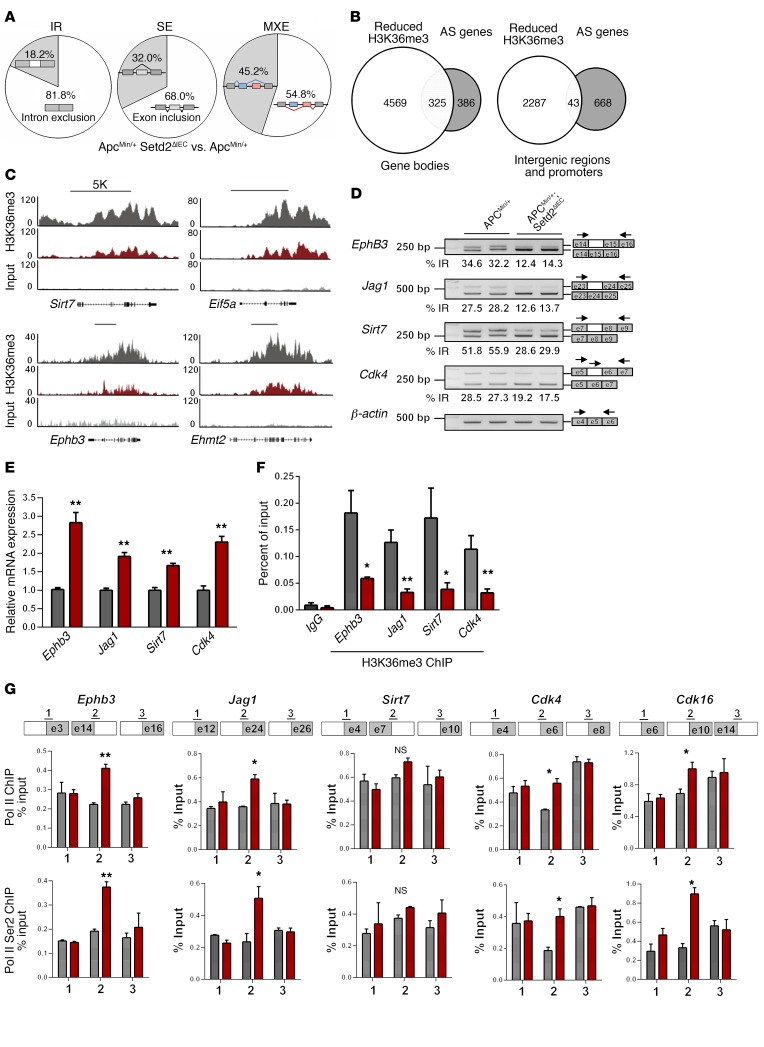
Figure 6. SETD2 regulates cancer-associated AS in Apcmin/+ mice.
(A) Pie graph summary of AS in SETD2 KO mice versus control mice. (B) Venn diagram indicates that altered AS genes (gray) preferably exhibited the decrease of H3K36me3 codes within gene bodies in comparison with the promoter and intergenic regions (P < 0.001; χ2 test). (C) Snapshot of H3K36me3 ChIP-Seq signal at the represented gene locus in control and Setd2-knockout mice. (D and E) Knockout of Setd2 in intestinal epithelium causes a decrease of IR (D) and an increase of mRNA levels of the indicated genes (E). Primers for examinations of IR are indicated by the arrows. (F) H3K36me3 codes in the areas of IR-related genes in the IECs of Apcmin/+ and Apcmin/+; Setd2ΔIEC mice. (G) ChIP-qPCR analysis of total Pol II and Ser2-phosphorylated Pol II enrichments in the IR gene locus, as indicated by number in control and SETD2-deficient Apc-mutated IECs. Statistical comparisons in E–G were made using a 2-tailed Student’s t test. *P < 0.05; **P < 0.01.

