
Figure 2.
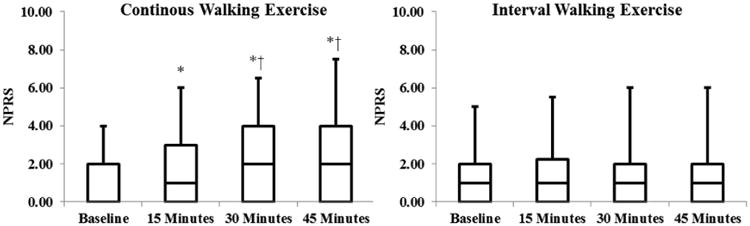
Box plots representing changes in numerical pain rating scale (NPRS) scores over time during the continuous and interval walking exercise conditions. Scores are presented as medians; the ends of the boxes define the 25th and 75th percentiles. * Denotes statistically significant difference from the baseline. † Denotes statistically significant difference from the 15-minute walking time point.