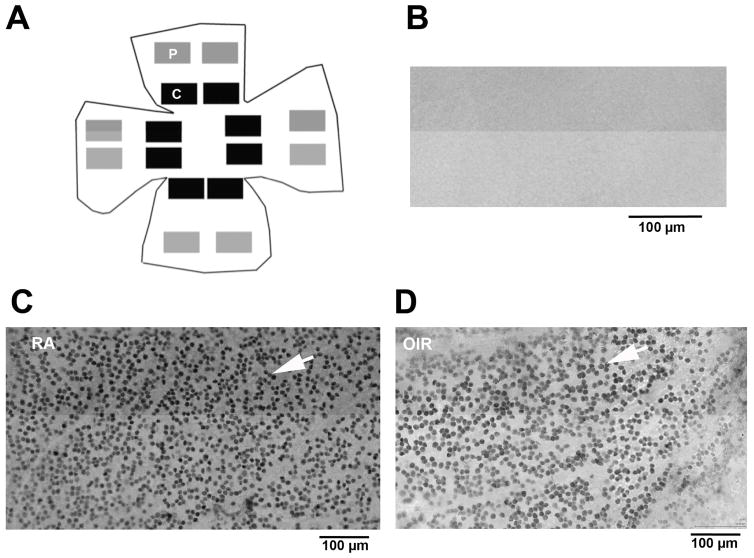
Figure 3. Diagram showing the image field locations used for measurement of RGC density in flat-mounted retinas.
Fields were selected from virtual microscopy scans of complete flat-mounted retinas (age P42) after immuno-labeling for Brn3a, a transcription factor present in the nuclei of retinal ganglion cells. (A) The number of Brn3a positive RGCs were counted by computer image analysis and averaged in 8 central (C, black boxes) and 8 peripheral (P, grey boxes) images. Examples of immuno-labeling quality from central regions are shown: (B) no-primary anti-body, negative control, (C) Brn3a positive RGC nuclei (white arrow) in a normal, room-air, retina, and (D) Brn3a positive RGC nuclei (white arrow) in an OIR retina.

