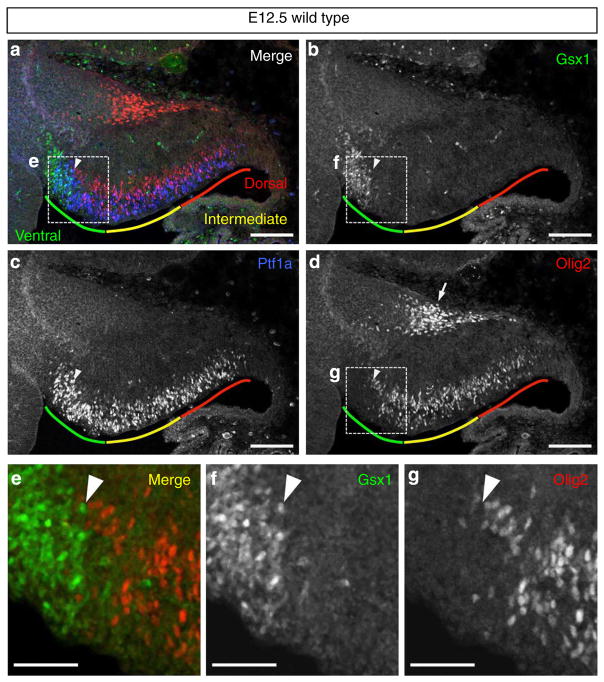
Figure 1. Mutually exclusive expression of Olig2 and Gsx1 in the cerebellar VZ at E12.5.
(a–d) Wild-type cerebellar primordium at E12.5 stained with antibodies for Gsx1, Olig2 and Ptf1a. Coloured lines indicate ventral (green), intermediate (yellow) and dorsal (red) regions of cerebellar VZ, respectively. Arrowheads indicate the boundary between Gsx1 and Olig2-expressing progenitors. (e–g) Higher-magnification images of the rectangular regions in (a), (b) and (d), respectively. Scale bars represent (a–d) 100 μm, (e–g) 50 μm.

