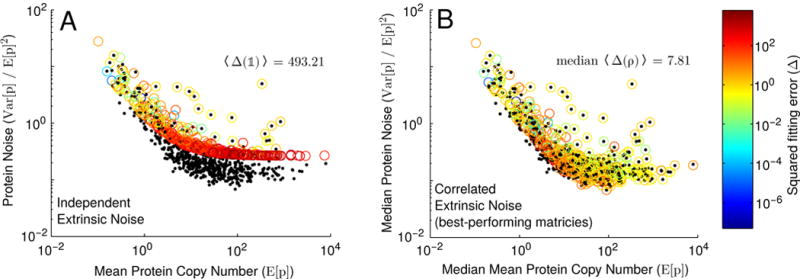
FIG. 4.

Fitting our model to the Taniguchi et al. dataset assuming either (A) all extrinsic noise sources act independently (i.e. ρ = 𝟙), or (B) extrinsic noise sources exhibit correlations among themselves (see Section IV). Black points represent experimental data from [2], while circles represent best fits from our model (colored by the squared fitting error, Δ(ρ), see Equation C1). Note that in (B), circles represent median values of E[p], V ar[p]/E[p]2 and Δ(ρ), calculated using the top 0.5% of sampled correlation matrices (see Section IV for details). Also noted is the mean squared fitting error, 〈Δ(𝟙)〉, when extrinsic noise sources are assumed to act independently, as well as the median mean squared fitting error for the best-performing matrices.
