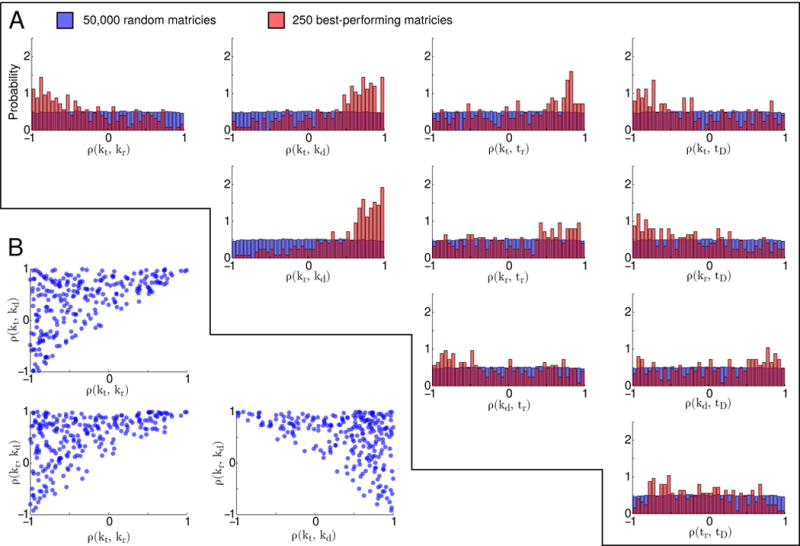
FIG. 5.

(A) Marginal distributions of off-diagonal terms in sampled correlation matrices. Blue indicates the distributions of all 50,000 matrices, while red indicated the distributions of the best-performing matrices (those among the 0.5% with lowest associated 〈Δ(ρ)〉 values). (B) Scatter plots of ρ(kt, kr), ρ(kt, kd), and ρ(kr, kd) with respect to each other for the best-performing matrices
