
FIG. 7.
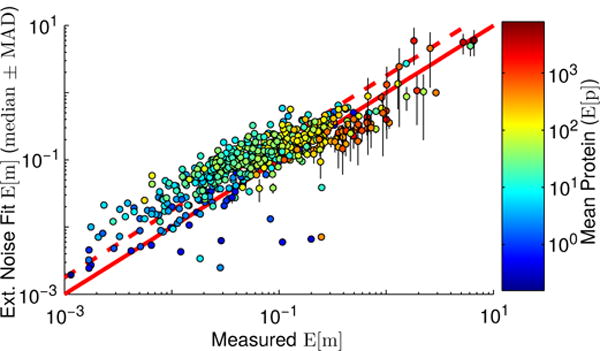
Comparison of experimental [2] and fit mean mRNA copy numbers. Points are colored by mean protein expression level, and represent the median mean mRNA copy numbers computed over our best-performing matrices, with their associated median absolute deviations shown with black vertical lines. The solid red line indicates the line of perfect agreement, while the dashed red line indicates the line of perfect agreement if the Taniguchi mRNA counts had been scaled to 2,400 total mRNA per cell.