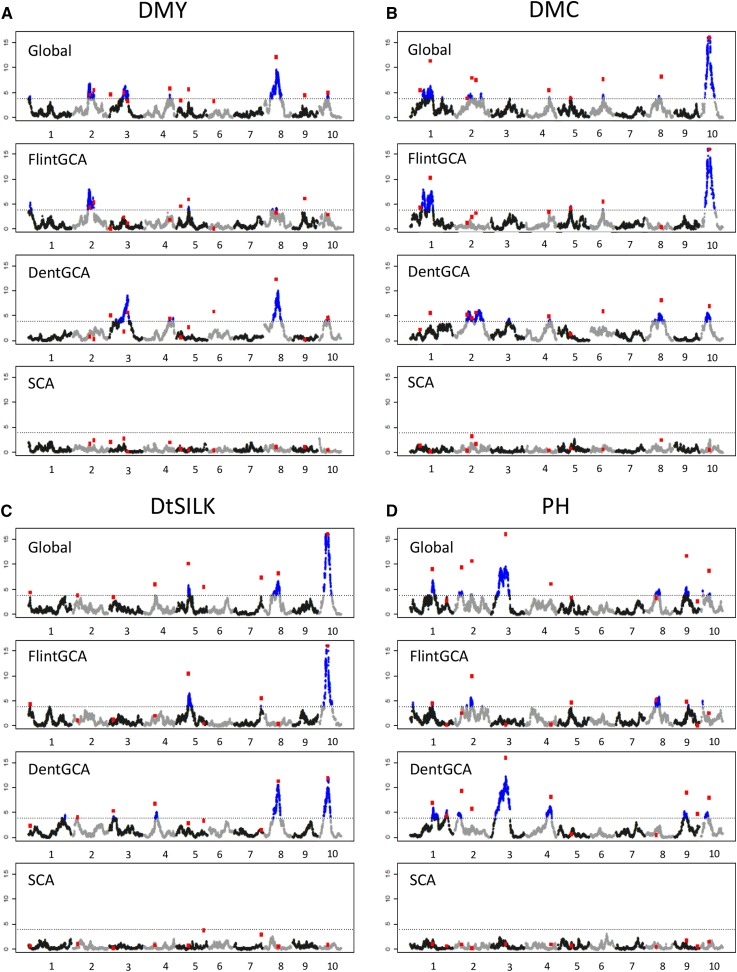
Figure 2.
QTL detected for the different traits: (A) DMY, (B) DMC, (C) DtSILK, and (D) PH. The chromosome number is indicated on the x-axis. For each trait, graphics correspond to the test of the global effect (“Global”) or of one component (“Flint GCA,” “Dent GCA,” and “SCA” effects). The blue (black) dots correspond to positions that were above (below) the threshold in the single-marker analysis (see File S7 for detailed results). The red ▪’s correspond to the −log(P-value) of the QTL that were included in the final multilocus model, with tests conditioned by the other QTL effects of the model. Note that values of −log(P-value) >16 were set to 16.

