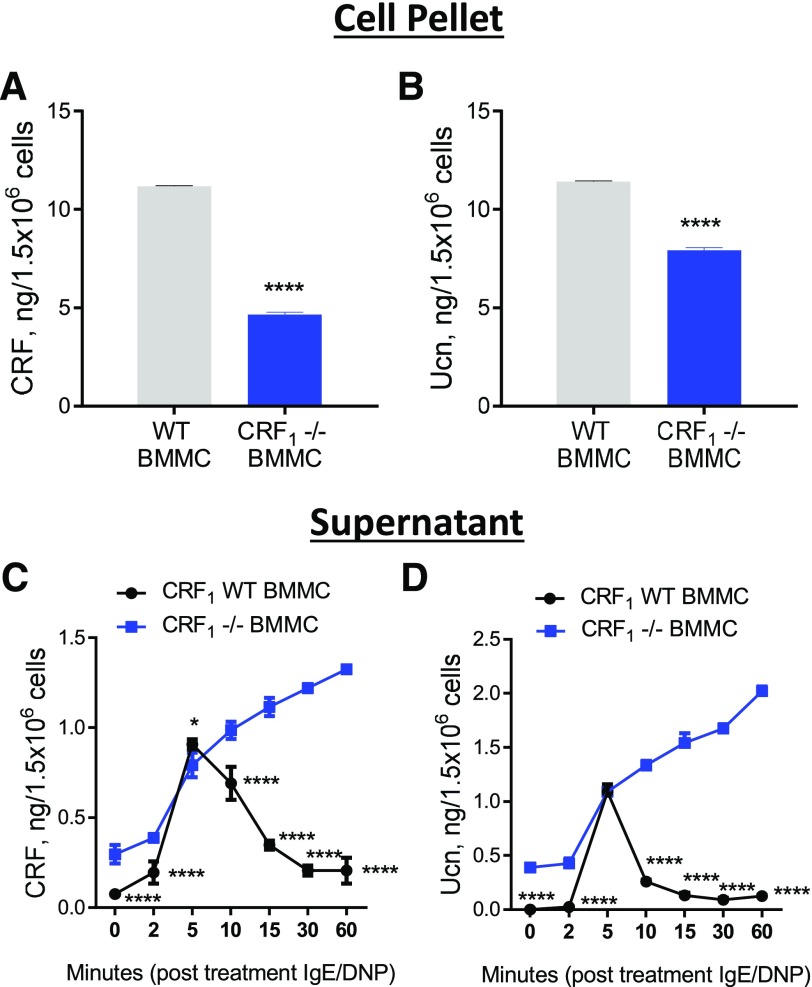
Figure 6. Concentrations of stored and released CRF and Ucn in WT and CRF1−/− BMMCs.
Concentration of CRF (A) and Ucn (B) in WT and CRF1−/− BMMC pellets, as determined by ELISA. Concentrations of CRF (C) and Ucn (D) in cell supernatants at indicated times after IgE/DNP stimulation. Data shown are the means ± se and are representative of 2 independent experiments performed in triplicate. Data were analyzed using either a t test (A and B) or 2-way ANOVA (C and D) with a post hoc Tukey’s test. *P < 0.05; **P < 0.001; ***P < 0.0001; ****P < 0.00001; *# P < 0.05 vs. other treatment groups (ANOVA).

