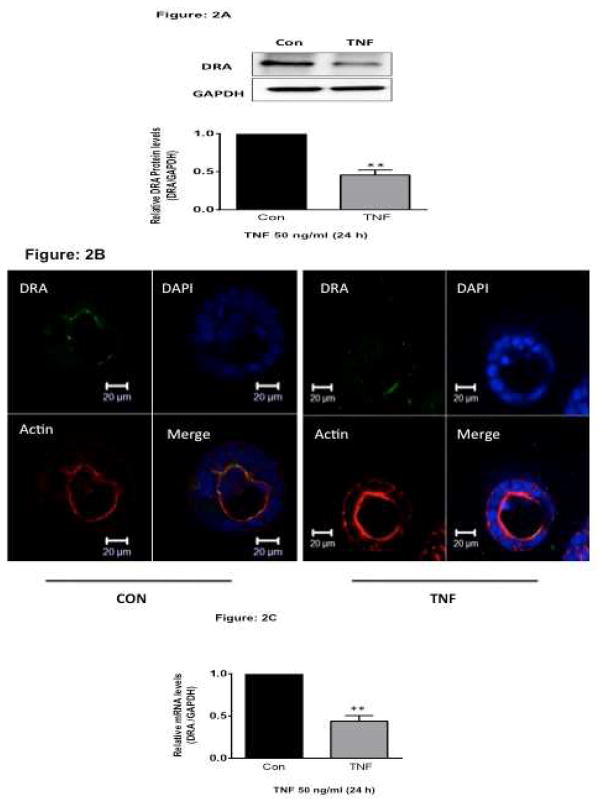
Figure 2. TNF decreases DRA expression in 3D-culture of Caco-2 cells.
Caco-2 cells grown in 3D culture system were treated with TNF (50 ng/ml, 24 h). (A). Protein lysates were prepared, run on 7.5% SDS-PAGE, transblotted, and Western blotting was performed utilizing anti-DRA antibody. Representative blot of 3 different experiments is presented. Densitometric analysis shows relative expression of DRA normalized to GAPDH. **P < 0.001 vs. control. (B). Untreated or TNF (50 ng/ml, 24 h) treated Caco-2 cells in 3D culture system were stained for DRA (green), Phalloidin (red) and DAPI (blue) and visualized by confocal microscopy. XY planar images and orthogonal XZ images were obtained with a Zeiss LSM 710 confocal microscope. (C). Total RNA was extracted and quantitative real-time RT-PCR was performed utilizing SYBR green fluorescent dye. Data represent the relative expression of DRA normalized to the respective GAPDH mRNA (internal control) levels. Results are expressed as fold-change in mRNA levels in treated cells compared with control. Data represent mean ± SEM of 4 separate experiments. ** p<0.001 compared with control.

