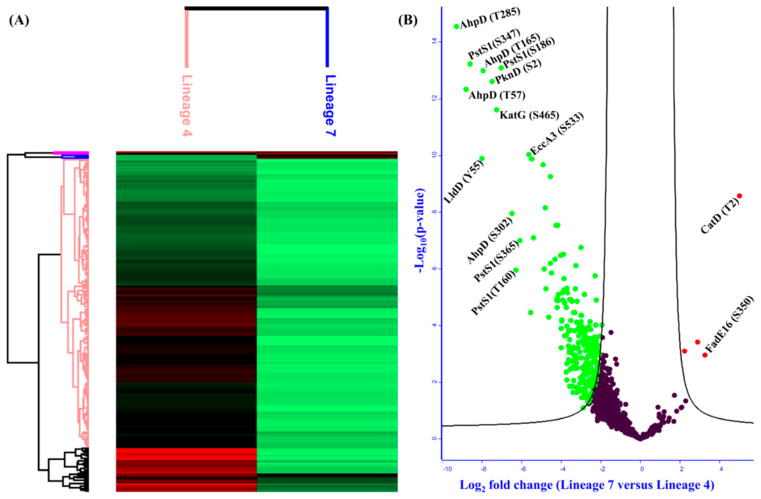
Figure 6.
(A) Hierarchical clustering of differentially acetylated proteins between lineage 7 and lineage 4 strains of Mycobacterium tuberculosis (Mtb). (B) Volcano plot of differentially acetylated proteins between lineage 7 and H37Rv (S0 = 2, FDR ≤ 0.05; −log Student’s t test p-value on the Y-axis and Student’s t test difference on the X-axis). Red: hyperacetylation; green: hypoacetylation.

