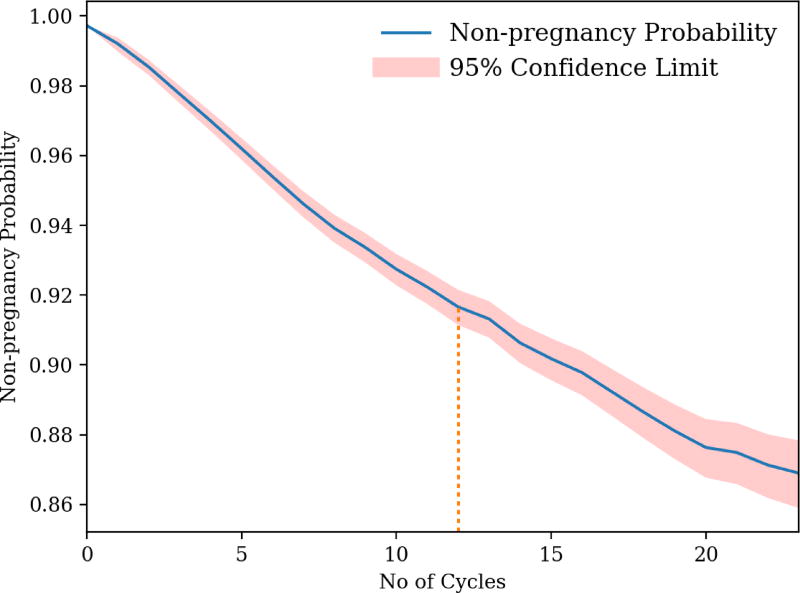
Figure 2. The lifetable non-pregnancy probability as a function of the number of cycles.
The 95% Confidence Interval (CI) calculated as suggested by Kalbfleisch and Prentice is indicated (pink band) [23]. The dotted orange line indicates the 13th cycle.

