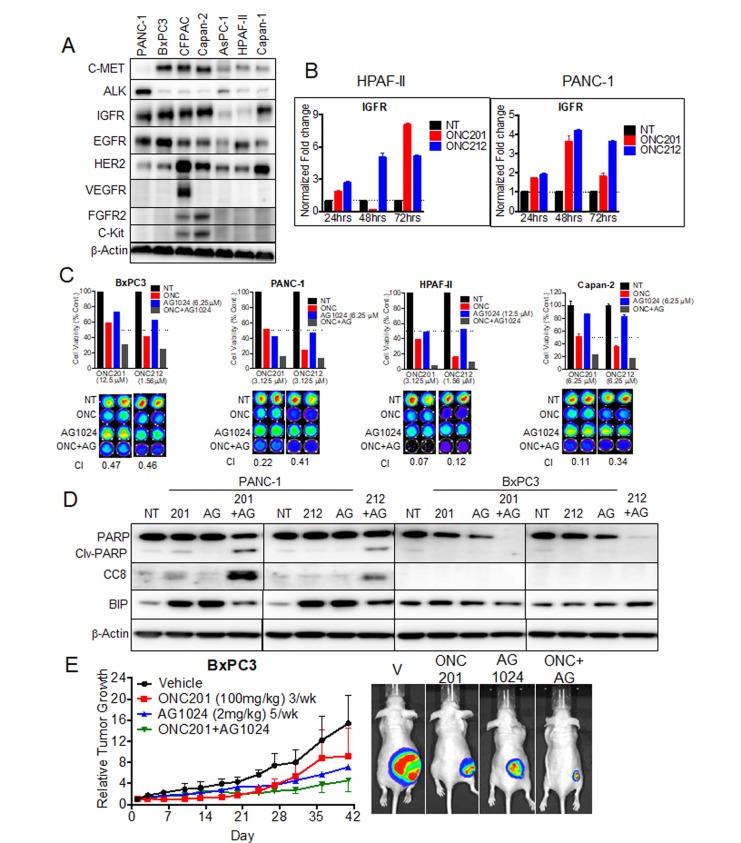
Figure 6. ONC201 and ONC212 show synergistic anti-cancer activity with IGF1-R inhibitor AG1024 in pancreatic cancer cell lines.
A. Representative western blot for expression of RTKs assessed from whole cell lysates of seven pancreatic cancer cell lines. B. qRT-PCR analysis of IGF1-R expression over time for the HPAF-II and PANC-1 cell lines, treated with 20 µM ONC201 or ONC212. C. Combination experiments with IGF1-R inhibitor AG1024 (0-25 µM) were assayed in both ONC201/ONC212-sensitive cell line HPAF-II and -resistant cell lines (PANC-1, BxPC3 and Capan 2). ONC201 and ONC212 were used in the ranges of 0-100 µM and 0-50 µM respectively. Synergy for AG1024-ONC201 or -ONC212 combinations was measured by cell viability 72 hours post-treatment using the CellTiter-Glo assay. (Top) Indicated graphs represent a selected synergistic dose of AG1024 and ONC201 or ONC212. (Bottom) CellTiter-Glo image and CI index (Bottom) for all four cell lines tested. D. PANC-1 and BxPC3 were treated with either 20 µM ONC201 or ONC212 or 5 µM AG1024 or combinations as indicated. Representative western blot for markers of apoptosis is shown 72 hours post-treatment. E. Combination efficacy of ONC201 (100 mg/kg, 3/week) and AG1024 (2 mg/kg, 5/week) was investigated in the BxPC3 xenograft model. (Left) Representative graphs of tumor growth over time are shown. (Right) Bioluminescence imaging was performed at the end of the experiment. Representative bioluminescence images for each treatment cohort are shown.

