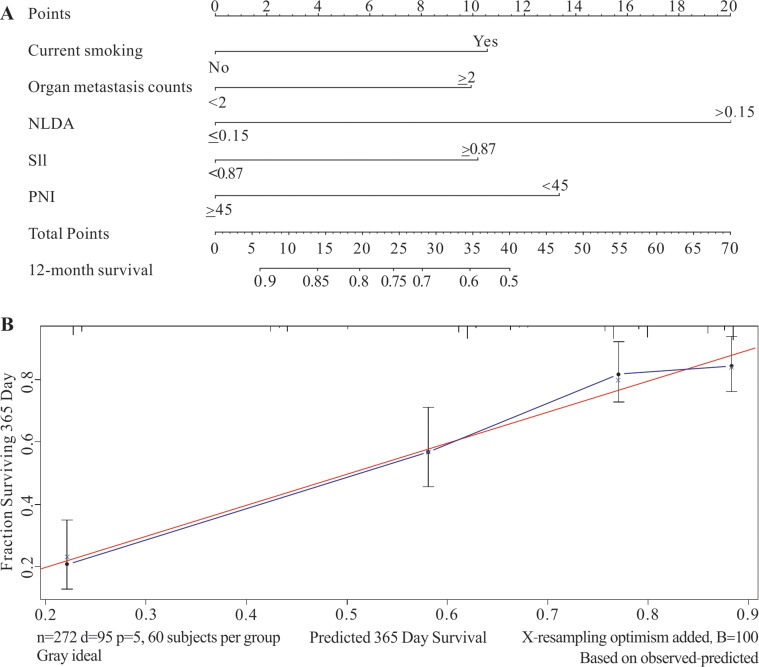
Figure 2. The nomogram and calibration curve of the retrospective study group.
The retrospective study was applied to establish the predictive prognostic model and to conduct internal validation. (A) The predictive prognostic model which illustrated that the value of NLDA was identified as the poorest prognostic factor in this study group. (B) The C-index of the internal validation was 0.738 (95% CI, 0.686–0.79) and the calibrated curve showed that the predictive model had high calibration with the clinic.

