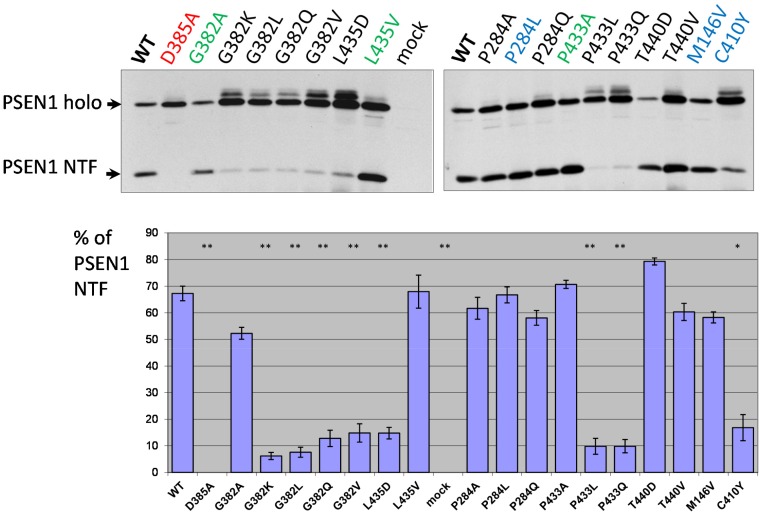
Figure 2. Study of PSEN1 mutants in presenilinase cleavage assay.
The cleavage product was detected by PSEN1 N-terminal antibody. Transfections were performed in PSEN1-/-/PSEN2-/- MEF cells. Histogram shows the percent ratio of PSEN1 NTF to uncleaved PSEN1 holoprotein. Error bars represent SE. In this and all other Figures, mutations in super-conserved aspartates are indicated in red, mutations with similar amino acid changes, which do not alter the physicochemical properties of the site, are in green and AD mutations are in blue. P-value significance codes: ‘**’ <0.01, ‘*’ <0.05.

