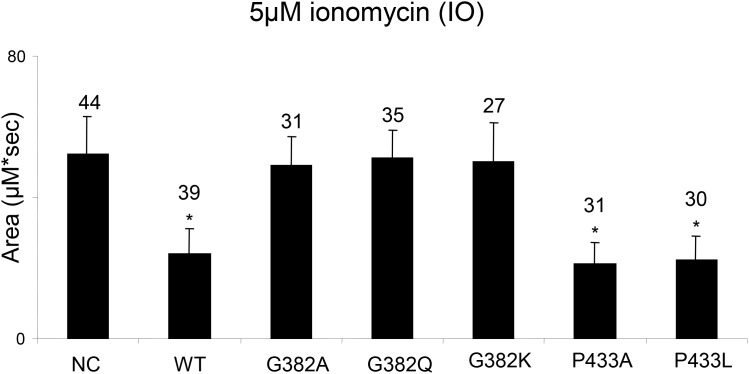
Figure 9. Study of PSEN1 mutants in low conductance ER Ca2+ leak assay.
The histogram shows the mean size of ionomycin (IO)-induced Ca2+ pool (±SD) in PSEN1-/-/PSEN2-/- MEF cells stably transfected with wild type (WT) or mutant PSEN constructs. pEGFP-C3 plasmid was used as a negative control (NC). ‘*’ p<0.05 by ANOVA – significant Ca2+ pool changes comparing to NC. The number of cells analyzed is indicated (n).

