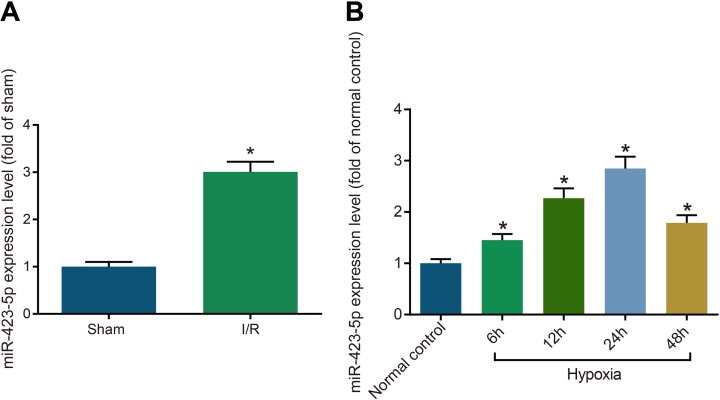
Figure 1. Increased miRNA-423-5p expression in kidney tissues after acute I/R and hypoxia/reoxygenation induced HK-2 cells.
(A) Estimation of miRNA-423-5p levels in kidney tissues of sham and I/R rats by qRT-PCR. (B) Analysis of miRNA-423-5p levels in normoxia and hypoxia HK-2 cells by qRT-PCR. Note: *denotes P < 0.05 in comparison with sham or normal control group; I/R, ischemia/reperfusion; qRT-PCR, quantitative real-time polymerase chain reaction; miR-423-5p, microRNA-423-5p.

