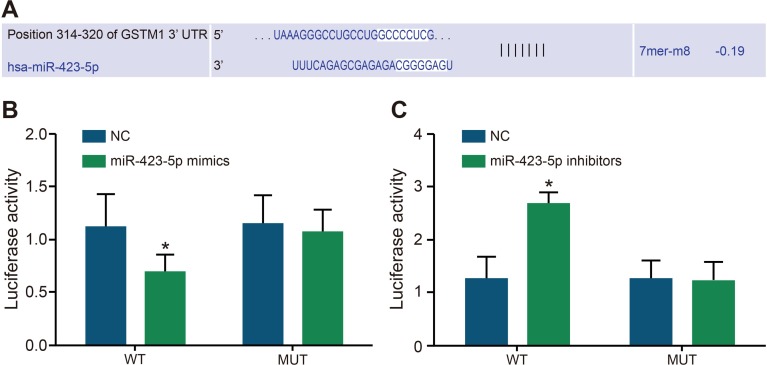
Figure 2. Dual luciferase assay analysis of miR-423-5p binding to GSTM1 3′UTR.
(A) Predicting miR-423-5p binding sites in GSTM1 sequence by miRBase. (B) Relative luciferase activity in HK-2 cells after co-transfection with miR-423-5p mimics and pGL3-GSTM1-WT or pGL3- GSTM1-MUT. (C) Relative luciferase activity in HK-2 cells after co-transfection with miR-423-5p inhibitors and pGL3-GSTM1-WT or pGL3- GSTM1-MUT. Note: *denotes P < 0.05 in comparison with the NC group; GSTM1, Glutathione-S-transferase (GST) M1; miR-423-5p, microRNA-423-5p; HK-2 cells, human renal tubular epithelial cells; NC, negative control.

