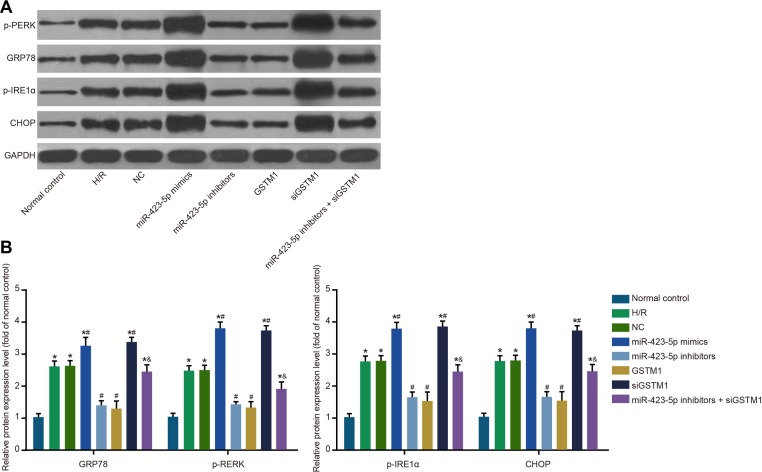
Figure 4. Analysis of ER stress in hypoxia/reoxygenation induced HK-2 cells.
(A) Analysis of ER-stress related proteins, GRP78, p-PERK, p-IRE1α and CHOP in (1) normal control, (2) H/R , (3) negative control, (4) miR-423-5p mimics, (5) miR-423-5p inhibitor, (6) GSTM1, (7) siGSTM1 and (8) miR-423-5p inhibitor plus siGSTM1 groups of H/R induced HK-2 cells by western blotting; (B) Relative levels of GRP78, p-PERK, p-IRE1α and CHOP proteins in the 8 experimental groups. Note: *denotes P < 0.05 compared with the normal control group; # denotes P < 0.05 compared with H/R group; & denotes P < 0.05 compared with miR-423-5p inhibitors group; miR-423-5p, microRNA-423-5p; GSTM1, Glutathione-S-transferase (GST) M1; ER, endoplasmic reticulum; GRP78, 78 kDa glucose-regulated protein; CHOP, C/EBP homology protein; NC, negative control; H/R, hypoxia/reoxygenation.

