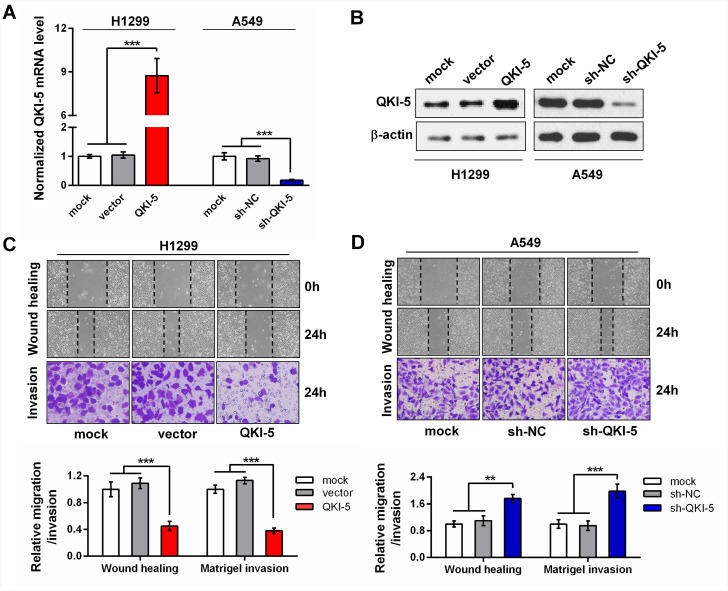
Figure 2. The inhibitory effects of QKI-5 on the migration and invasion of LC cells.
(A and B) Detections of mRNA (A) and protein (B) of QKI-5 overexpression and knockdown efficiencies in stable H1299 and A549 subcell lines constructed with indicated viruses or plasmids. The QKI-5 mRNA level was analyzed by qRT-PCR and normalized against GAPDH. The ratios of QKI-5/GAPDH in the mock groups were arbitrarily set to 1.0. (C and D) Representative images (upper) and quantitative data (bottom) of migration and invasion of the indicated H1299 (C) and A549 (D) subcell lines assessed by wound-healing and transwell assays. All the experiments were performed at least in triplicate and the data in A, C and D are presented as the mean ± SD. **P<0.01, ***P<0.001.

