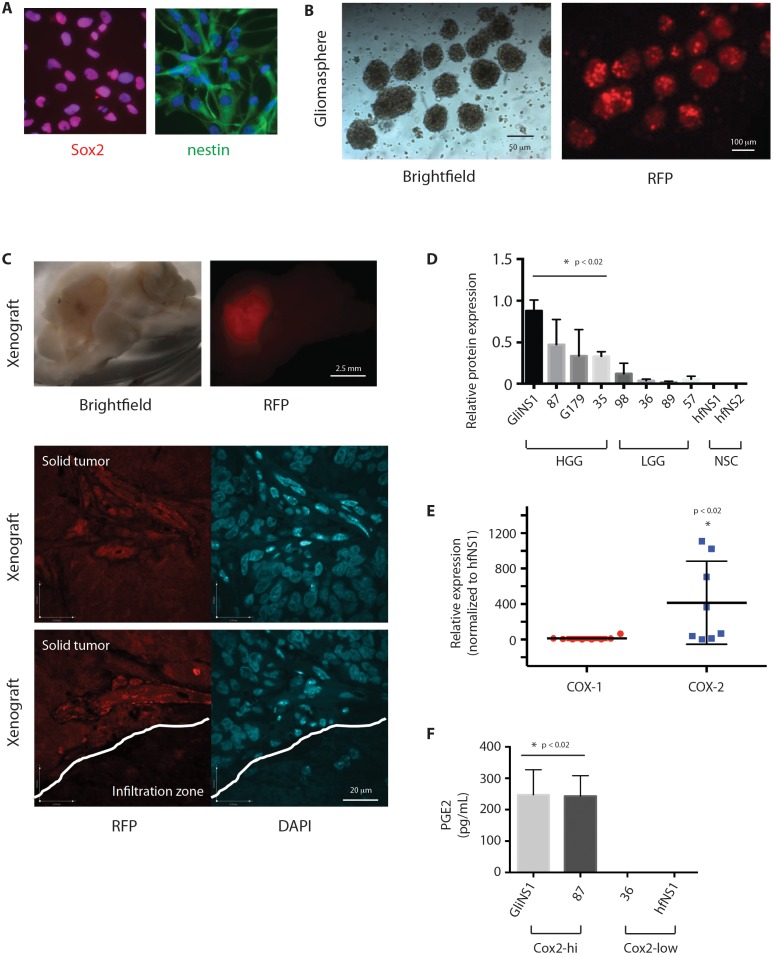
Figure 2. Cox-2 is enriched in GSCs and results in production of PGE2.
(A) GSC lines were subjected to immunofluorescence with antibodies against Sox2 (red) or nestin (green), and Hoechst nuclear stain (blue). (B) RFP-expressing GSCs were grown as gliomaspheres and (C) injected into the right putamen of NOD-SCID mice. Animals were sacrificed after 2 months. Sectioned brains were subjected to Brightfield microscopy and immunofluorescent microscopy for RFP. (D) Relative quantification of COX-2 protein levels as determined by Western blot analysis of lysates from HGG-derived GSCs (GliNS1, 2012087, G179, 2014035), LGG-derived GSCs (2015098, 2014036, 2015089, 2014057), and human fetal NSCs (hfNS1, hfNS2). (E) Cox-1 and Cox-2 protein expression in GSCs (GliNS1, 2012087, G179, 2014035, 2015098, 2014036, 2015089, 2014057) compared to hfNSCs (hfNS1, hfNS2). (F) PGE2 production in GSCs with high (GliNS1, 2012087) or low (2015089, 2014057) basal Cox-2 expression. Data are represented as mean ± SEM.

